
Ultrasound and Color Doppler imaging of vascular diseases
Contents of this page
- Ultrasound and color doppler images of the normal renal arteries and renal veins
- More ultrasound/ Color Doppler images of the origin of the Normal Right renal artery
- Ultrasound and color Doppler images of Dystrophic calcification of carotid arteries
- Color Doppler imaging of the Normal Carotid and vertebral arteries
- Spectral Doppler waveforms of the normal ICA (internal carotid artery)
- Another sign to identify the ECA (external carotid artery)
- Intima-media thickness (IMT) of carotid artery
- Ultrasound and Color Doppler imaging of vertebral artery
- Carotid artery plaque
- Case-2:Carotid artery plaque with calcification and ulceration
- Internal Carotid artery occlusion
- Ectasia of Internal Jugular vein
- Color and Spectral Doppler Examination of the veins of the Lower limb
- Chronic venous insufficiency (Incompetence of great saphenous vein)
- Sapheno-femoral junction and sapheno-femoral incompetence
- Incompetent perforators in a case of varicose veins
- Popliteal vein thrombosis
- Femoral vein thrombus
- Deep vein thrombosis- thrombus in deep veins of lower limb
- Celiac Artery and its branches
- Prosthetic vascular grafts- Color Doppler imaging of axillofemoral graft
- Aneurysm of abdominal aorta
- Case-2: Aortic aneurysm
- Below are the CT scan images of this same case of aortic aneurysm
- 3D CT scan reconstruction of the abdominal aorta
- PICC or Peripherally Inserted Central Catheter (in Inferior Vena Cava)
- Multiple neck artery disease (stenosis and occlusion) with subclavian steal
- Internal jugular vein thrombosis
- Primary venous tumor of short saphenous vein
Ultrasound and color doppler images of the normal renal arteries and renal veins
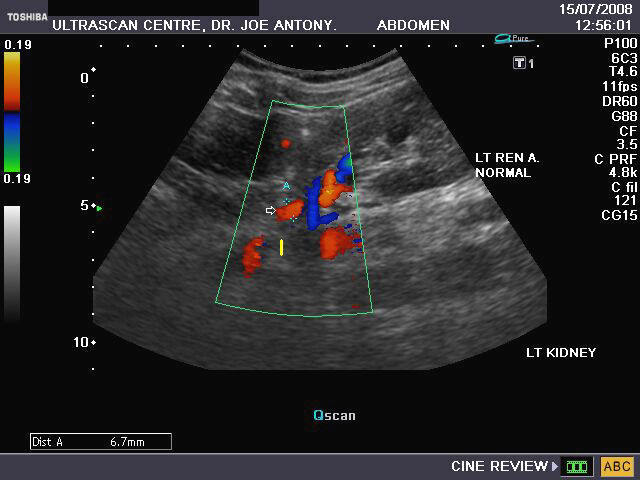
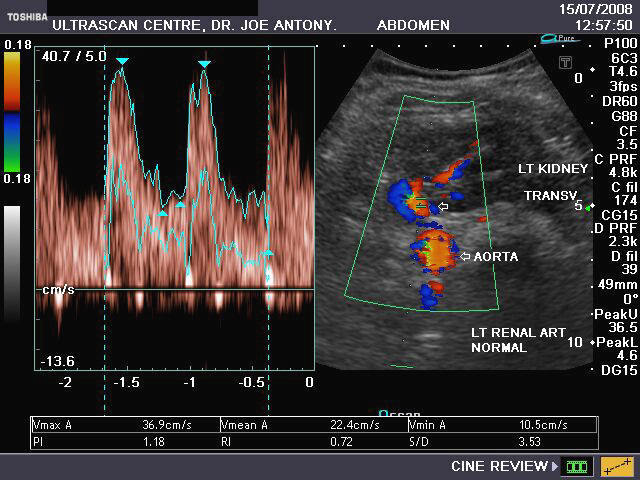
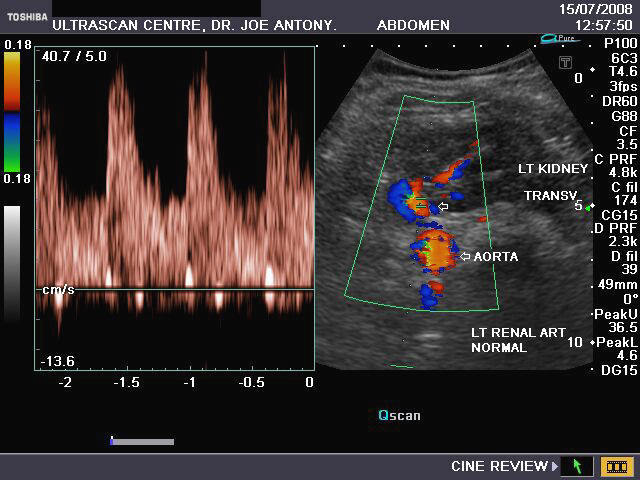
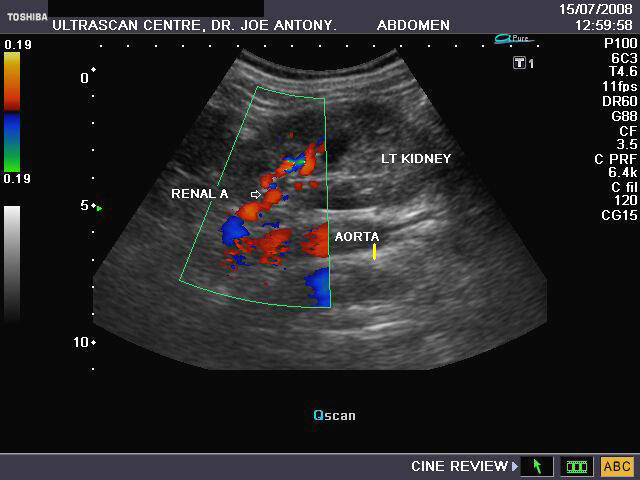
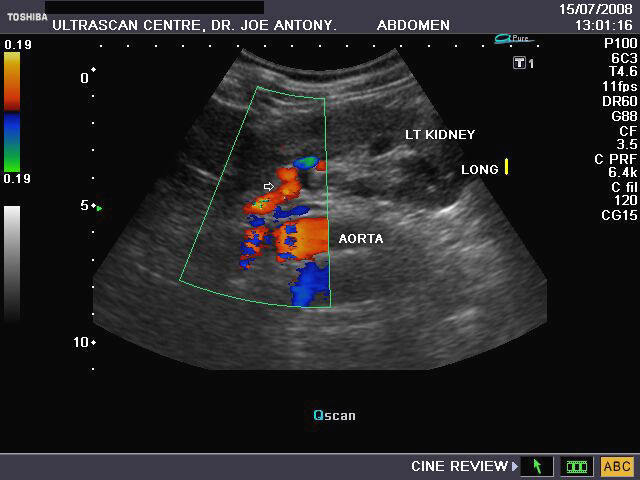
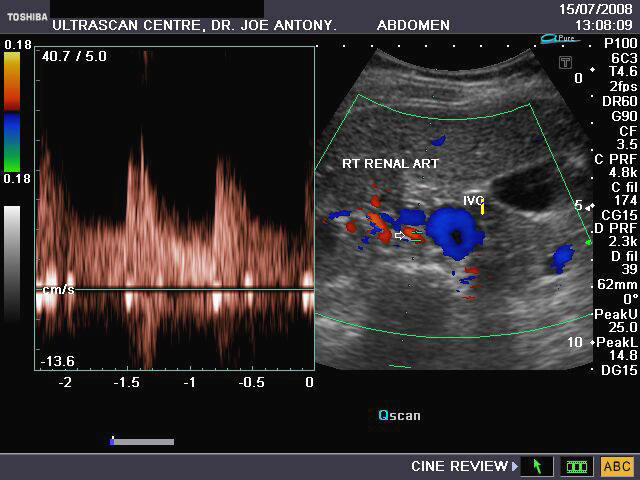
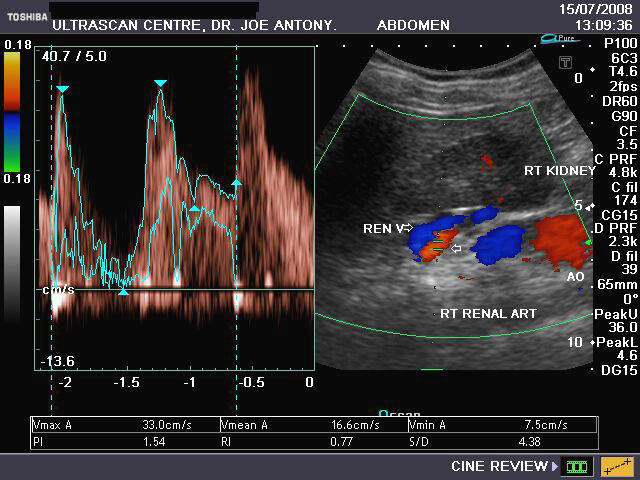
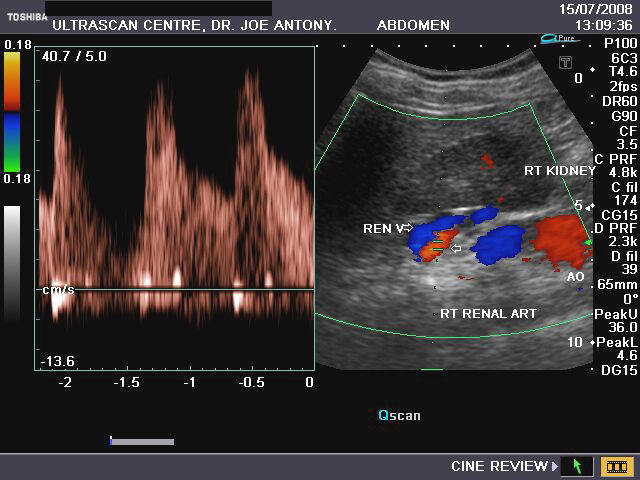
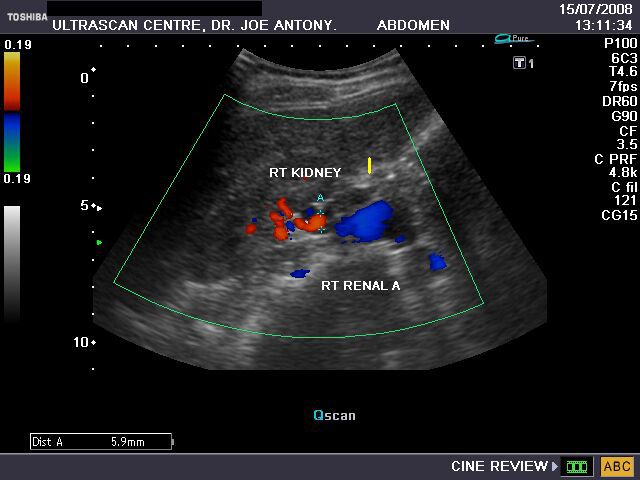
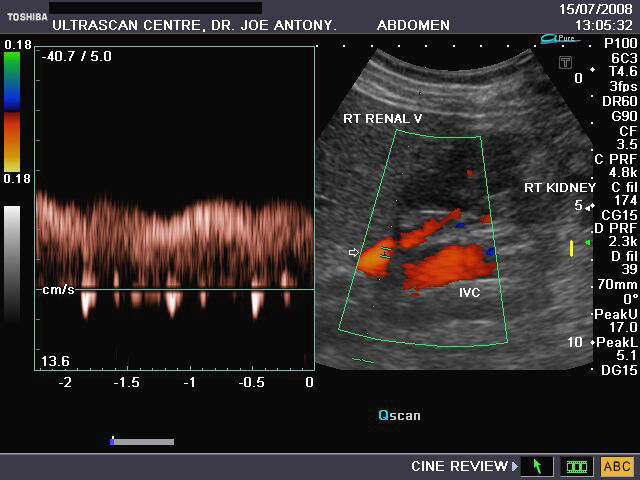
It takes patience and favourable imaging conditions (like thin abdominal wall and patient cooperation) to locate the renal arteries and veins by color doppler and even more difficult to get a spectral waveform tracing of the vessels. The upper few color doppler images show the left renal artery as it emerges from the abdominal aorta and enters the renal hilum. The lower few images show the right renal artery and right renal vein. Spectral tracing shows typical normal arterial and venous flow patterns. Ultrasound and color doppler images taken using a Toshiba Nemio XG color doppler machine by Joe Antony, MD, Cochin, India.
More ultrasound/ Color Doppler images of the origin of the Normal Right renal artery
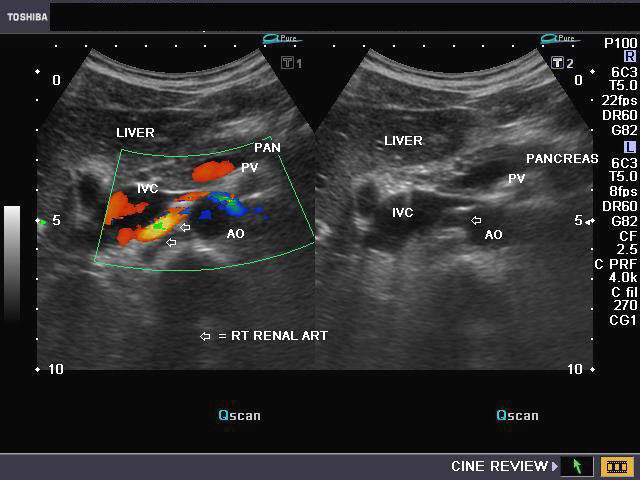
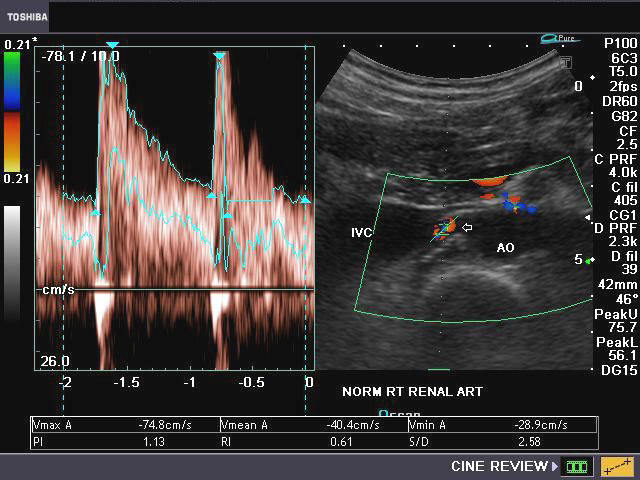
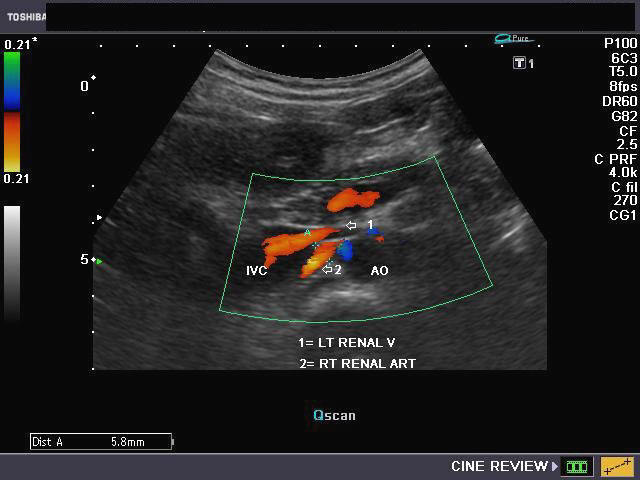
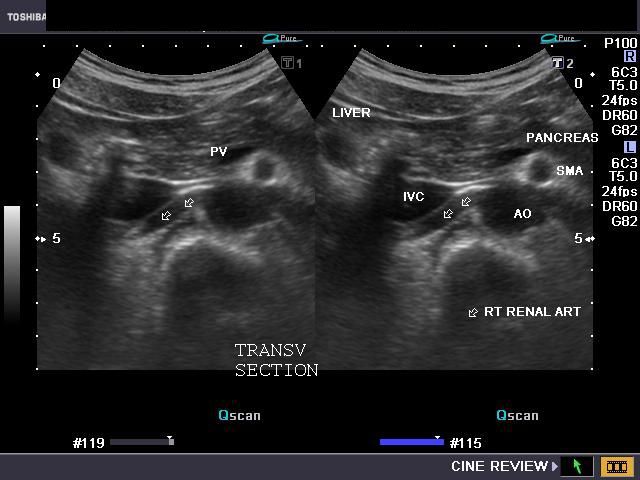
The above 4 ultrasound and Color Doppler images show the origin of the normal right renal artery from the abdominal aorta (Ao), just below the origin of the superior mesenteric artery. It takes careful adjustment of the wall filter settings to remove the motion artifacts from the aortic pulsations, with appropriate PRF settings to get a decent Color Flow image of the Right renal artery. The right renal artery is seen coursing behind the IVC (Inferior Vena Cava) after a antero-lateral origin from the Aorta (Ao). The left renal vein is also seen traversing anterior to the abdominal aorta (Ao) and between it and the SMA (superior Mesenteric Artery). All the above 4 images are transverse sections through the epigastrium. The liver provides a good window to view these vessels.
Ultrasound and color Doppler images of Dystrophic calcification of carotid arteries

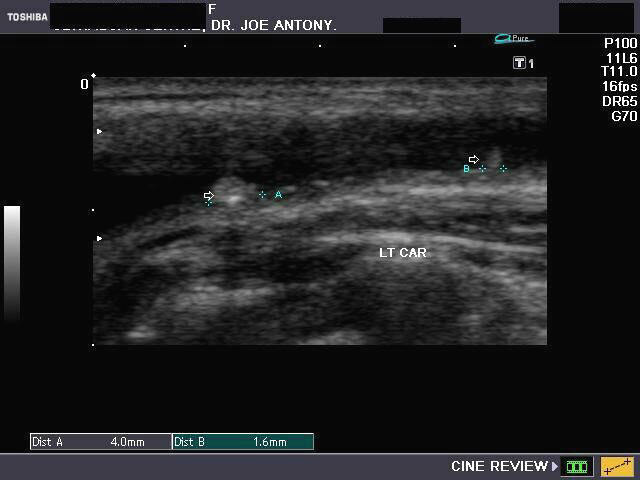
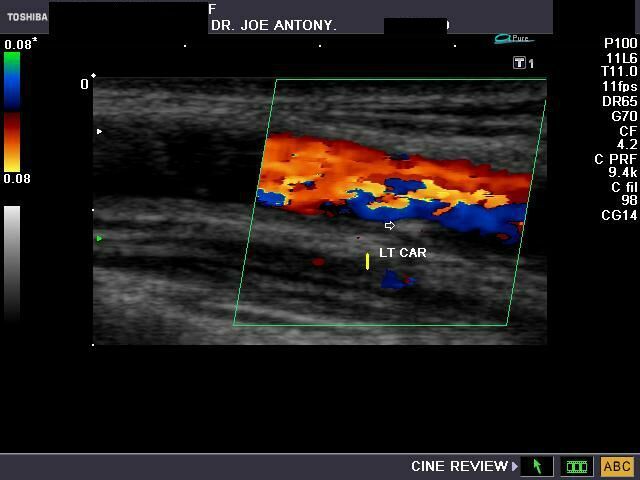
Calcific lesions of carotid arteries
These ultrasound images of a young, asymptomatic adult female patient reveal multiple calcific plaques of the common carotid arteries of both sides. The intimal plaques measure 1.5 to 4mm. in size. These sonographic images are diagnostic of dystrophic calcification of the intima of the carotid arteries. Such lesions are very unlikely to cause stroke or thromboembolic events and are hence of little significance. All ultrasound images taken with a Nemio - XG ultrasound system, by Joe Antony, MD, India.
References:
1) http://www.evtodayarchive.com/03_archive/0902/et0902_15.html(a good article.. free).
2) http://stroke.ahajournals.org/cgi/content/abstract/24/9/1330(abstract)
Color Doppler imaging of the Normal Carotid and vertebral arteries
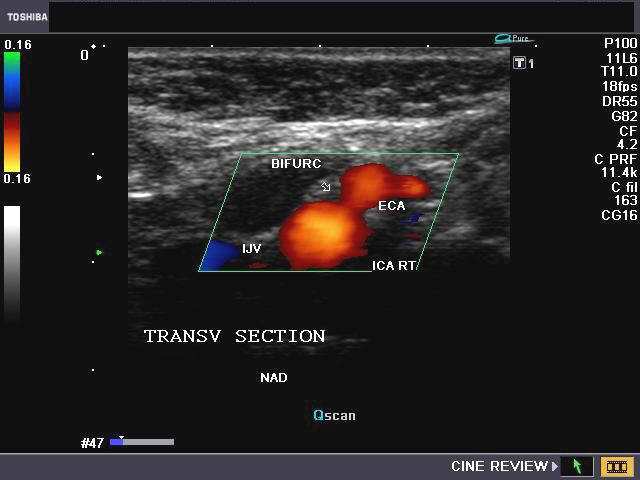
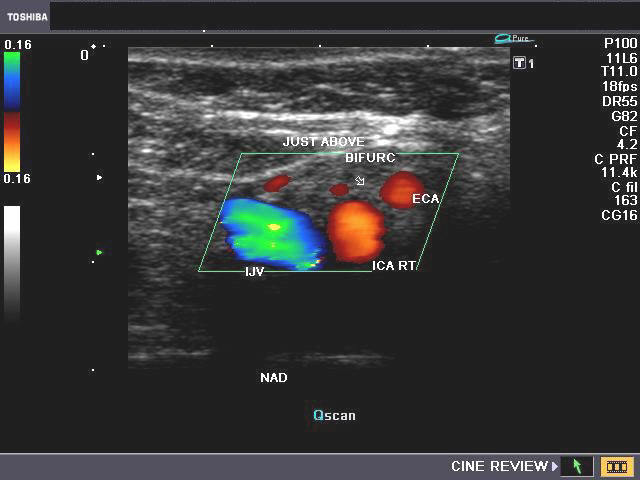

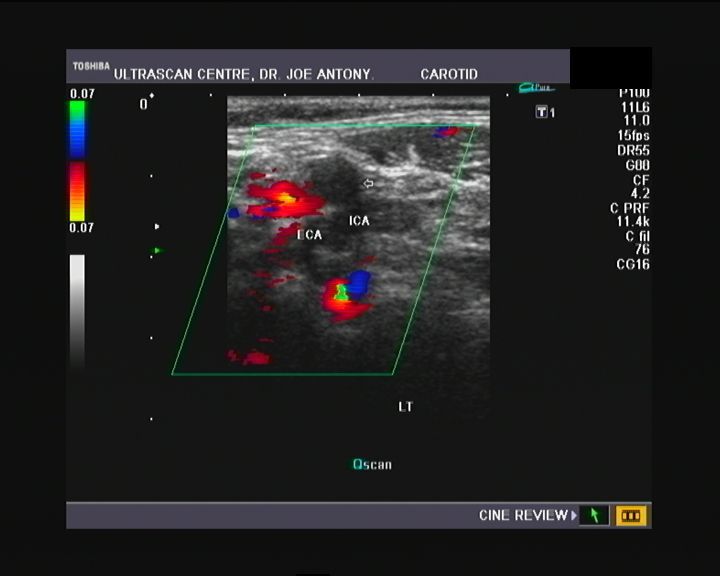
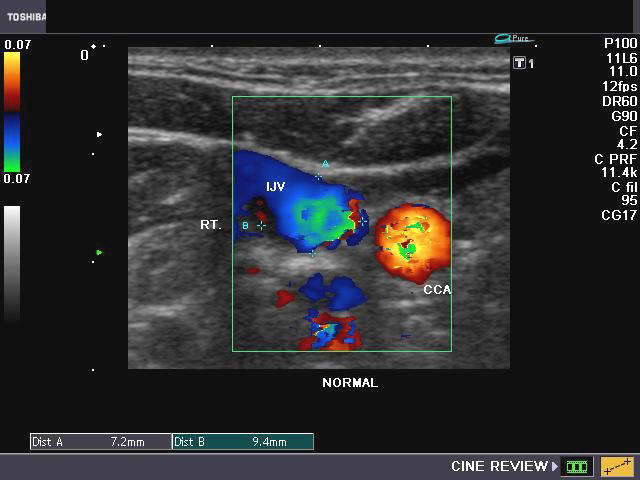
The carotid bifurcation
The above color Doppler images show a cross section through the bifurcation of the (Rt.) common carotid artery into its two main branches: 1) Rt. ECA- the external carotid artery 2) Rt. ICA- the internal carotid artery. The image on right shows a section just above the bifurcation. IJV= the internal jugular vein (seen in blue color). Note that the ECA is more anterior and medial to the ICA. Also, the ICA (internal carotid artery) is larger than the other branch- the ECA.
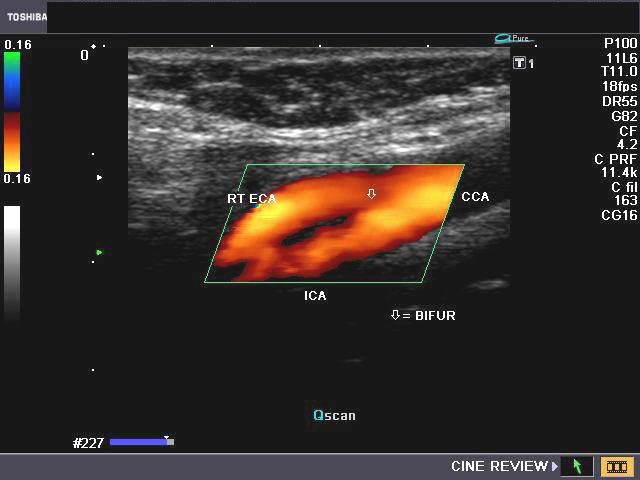
The above Color Flow images show a long section through the Rt. CCA (common carotid artery) bifurcating into the ICA (internal carotid artery) and ECA (external carotid artery). Note the wider caliber of the ICA. (arrow points to the bifurcation).
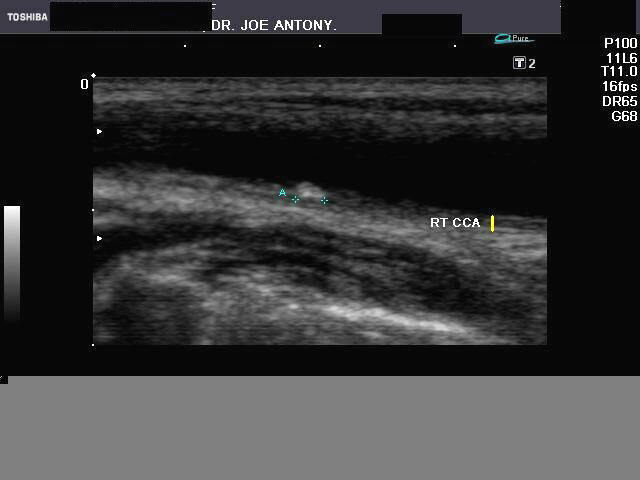
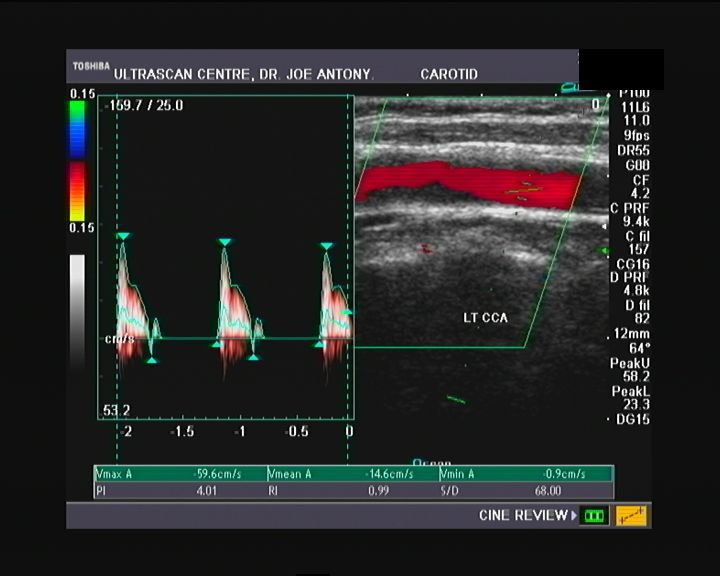
Spectral Doppler waveform of the normal Common carotid artery (CCA)
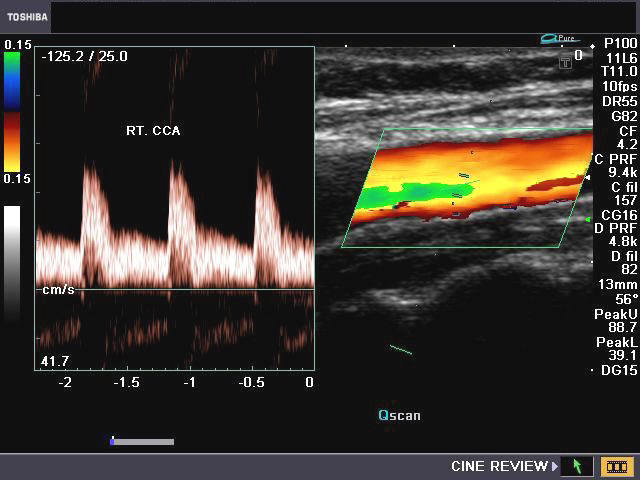
The above images (Rt. CCA) show moderately broad systolic peaks and moderate diastolic flow in diastole. The peak systolic velocity (PSV or V-max) is also in a range between that of the ICA and ECA. This is the typical appearance of the waveform of the CCA. Normal PSV for the CCA is usually less than 100cms./sec. (In this case, the PSV= 94 cms./sec.). The PSV in the CCA increases towards its proximal part (ie: towards the aorta).
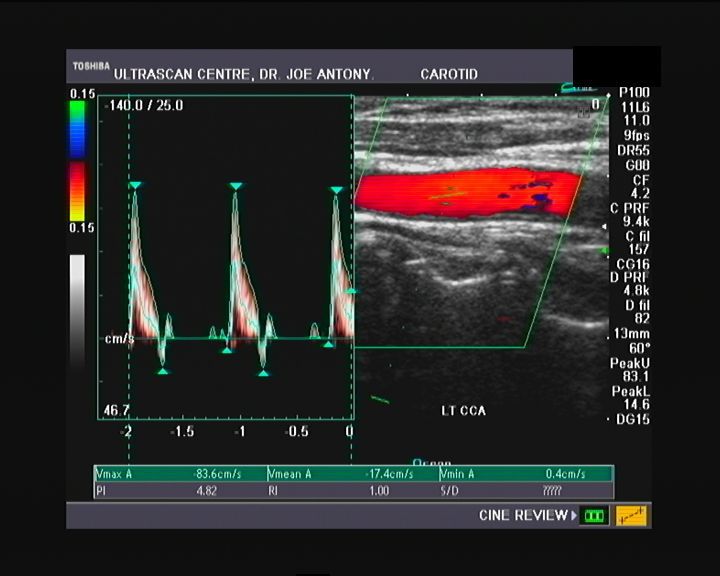
Spectral Doppler waveforms of the normal ICA (internal carotid artery)
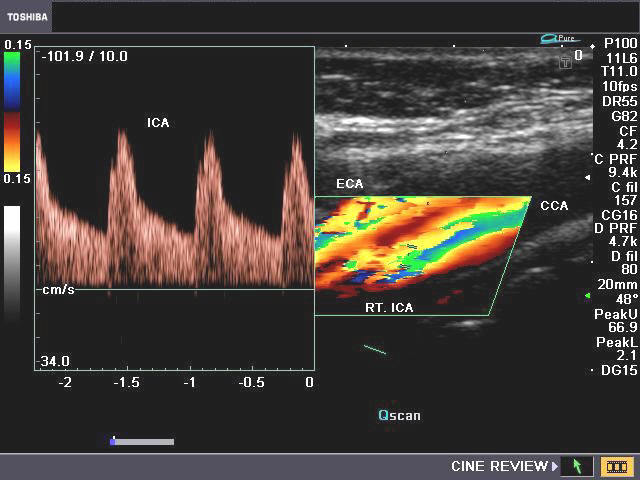
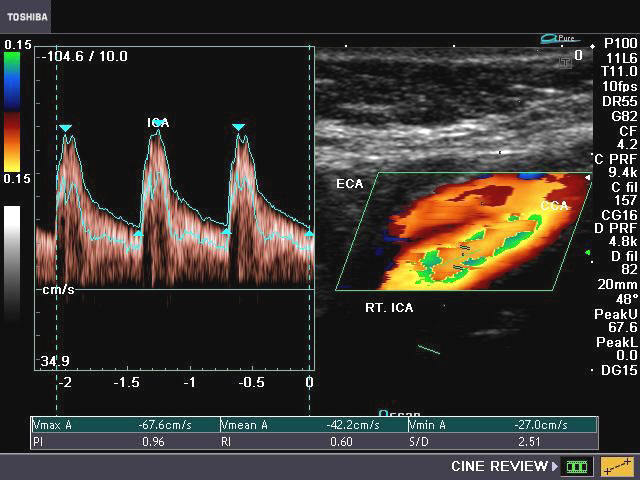
The Doppler images above show the spectral waveform of the normal ICA (Internal carotid artery-Rt.). The systolic peak in the ICA is broader than the ECA or even the CCA. Also, note the high (and persistent) diastolic flow. The normal PSV (Vmax in our image), ranges from55 to 88 cms./sec. in the ICA. This is true for the post bulbar (part distal to the carotid bulb) part of the ICA. (In our case the PSV or Vmax = 68 cms./sec).
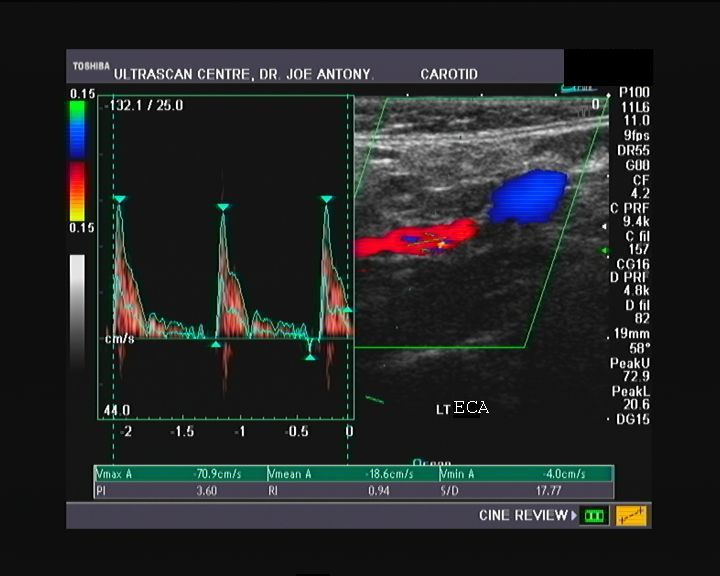
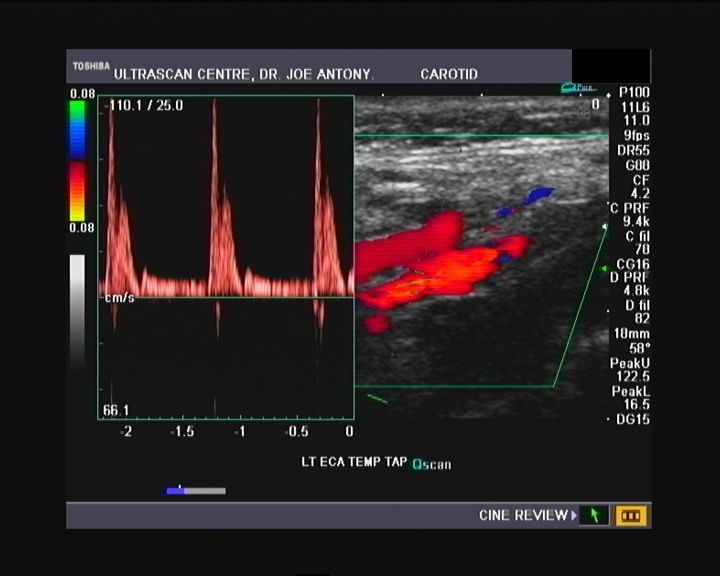
Doppler waveform of normal ECA (External carotid artery)
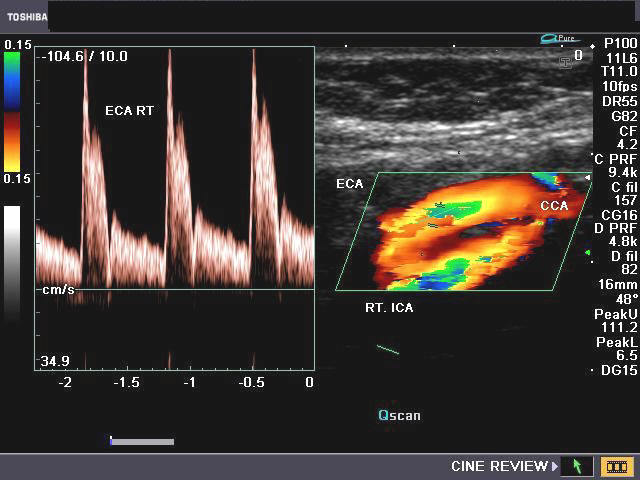
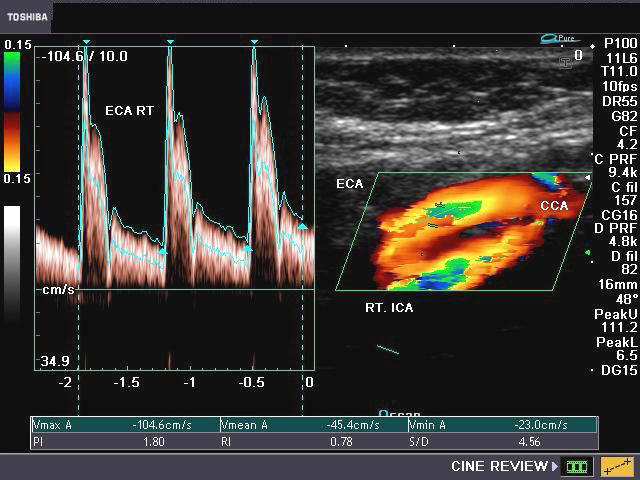
The ECA (right ECA here) shows very high (compared to ICA) PSV values and hence a sharp systolic peak and rather poor flow during diastole (seen as low EDV or end diastolic velocity). The PSV (Vmax) in this case is = 105/cms./sec. The normal range of PSV (peak systolic velocity) for the ECA is from 77 cms./sec. to 115 cms./sec.
The temporal tap sign of the (ECA) External carotid artery
An important method of differentiating the ECA from the ICA is the "temporal tap" sign. Tapping the temporal artery (a branch of the ECA) at the level of the zygomatic arch, just anterior to the external ear, produces fluctuations in the spectral waveforms of the ECA. This is seen in the above ultrasound images showing vertical dips and peaks during the diastolic flow. (Compare the Doppler images on left (without the tap) with the image on right (during temporal tap)).
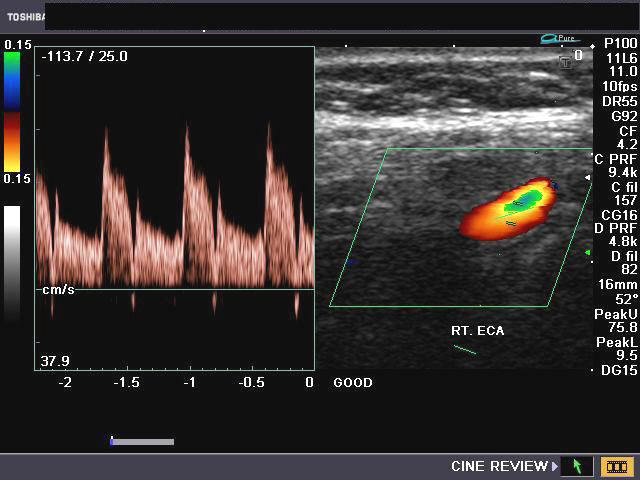
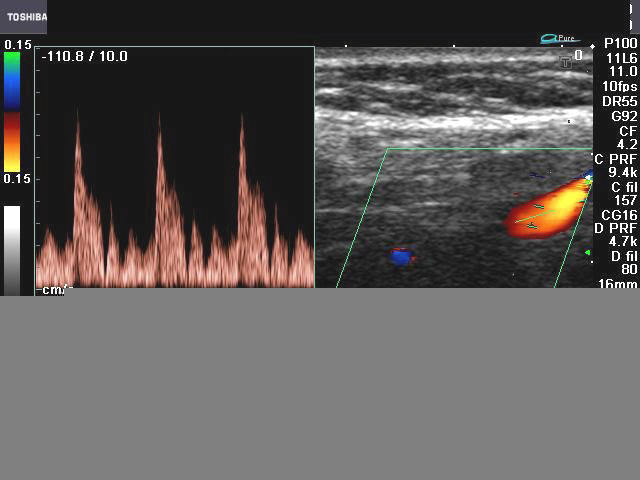
Another sign to identify the ECA (external carotid artery)
ECA- systole
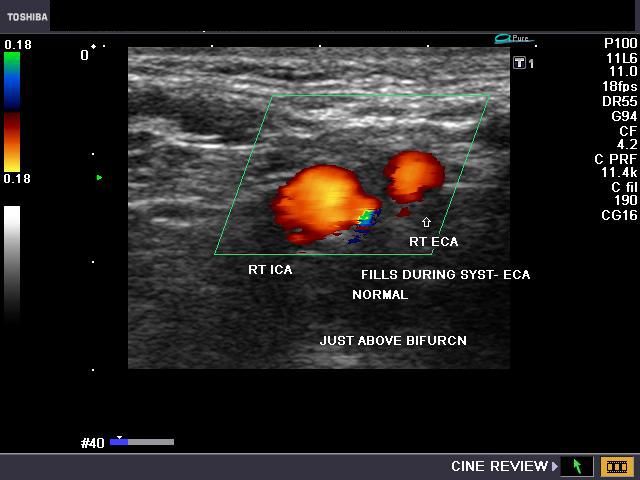


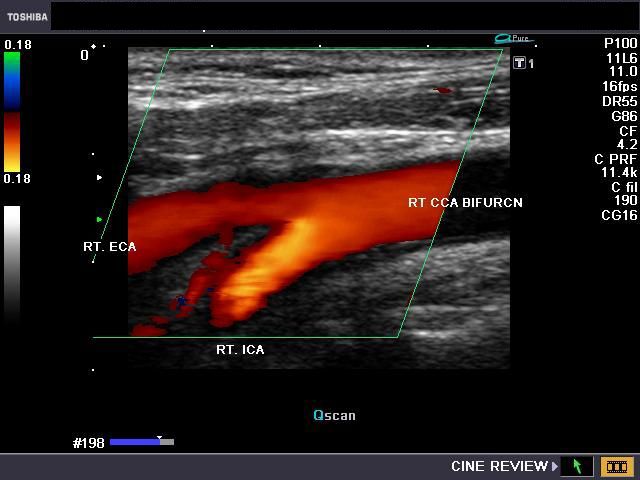
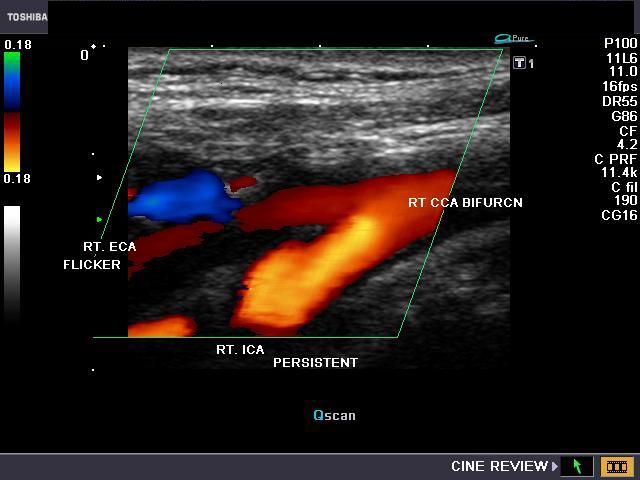
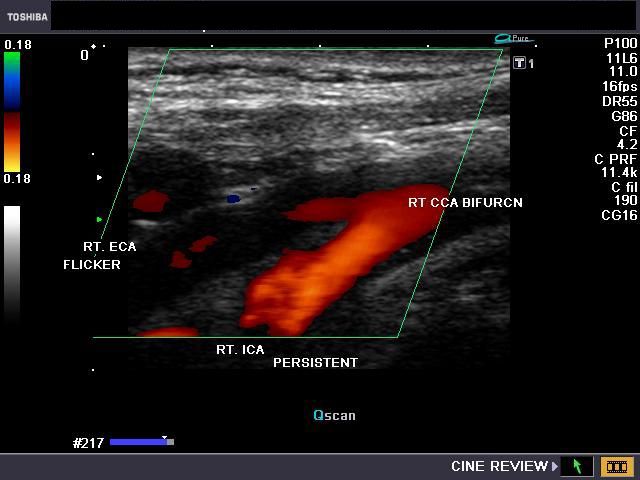
A very useful sign to identify the normal ECA is looking for flicker or fading out of the Color Doppler flow in the ECA during diastole. This is due to the very low absent flow in the ECA during diastole, as opposed to the ICA and CCA, both of which show significant flow during diastole. As a result, the ECA flickers on during cardiac systole (see Color Doppler images of the ECA and ICA above) and fades out (absent flow) during diastole). 3 of the Color Doppler images above are axial sections through the ECA and ICA while the other 3 images show the ECA and ICA just emerging from the bifurcation of the CCA (common carotid artery). All images by Joe Antony, MD. Machine used here is the Toshiba Nemio-XG ultrasound system.
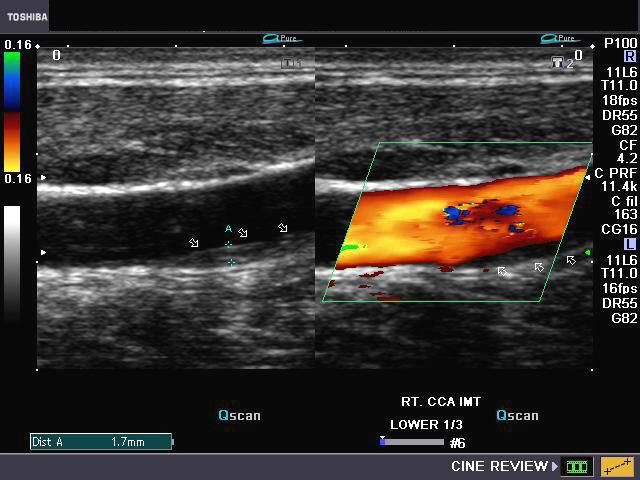
Intima-media thickness (IMT) of carotid artery
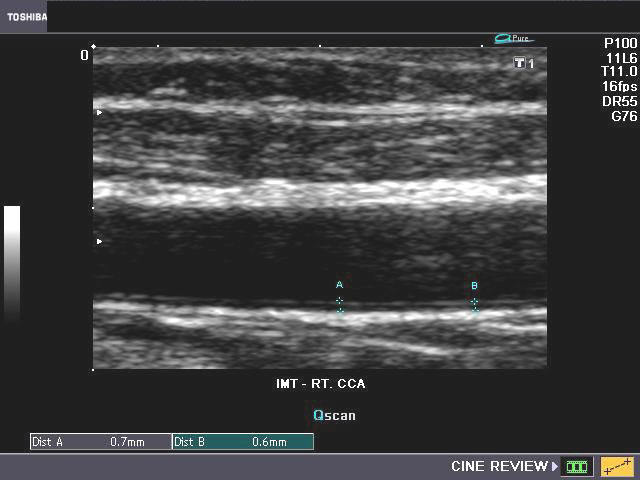
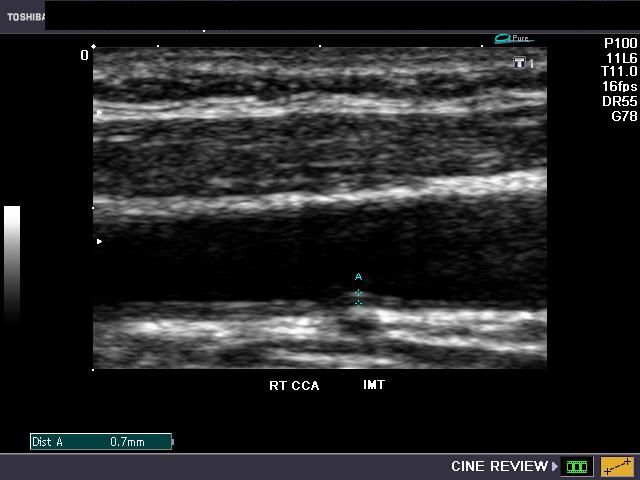
The carotid artery/ arteries consist of 3 layers- the intima (the inner most thin layer of endothelium), the middle layer or media (formed by smooth muscles) and the outermost layer- the adventitia (formed by loose connective tissue. On grey scale sonography, the long section ultrasound image produces 2 parallel lines - the inner most line is bright (echogenic), thin and corresponds to the intima; the media is the dark line just outer to the intima. The measurement of the total thickness (intima media thickness) or IMT helps assess the arterial wall for presence of plaques or thickening. Normal common carotid artery thickness should be less than 0.9 mm. In the ultrasound images above, the IMT measures 0.6 to 0.7 mm. (normal).
Reference:
http://www.ajronline.org/cgi/content/full/181/6/1695#SEC2 (free article and images)- excellent
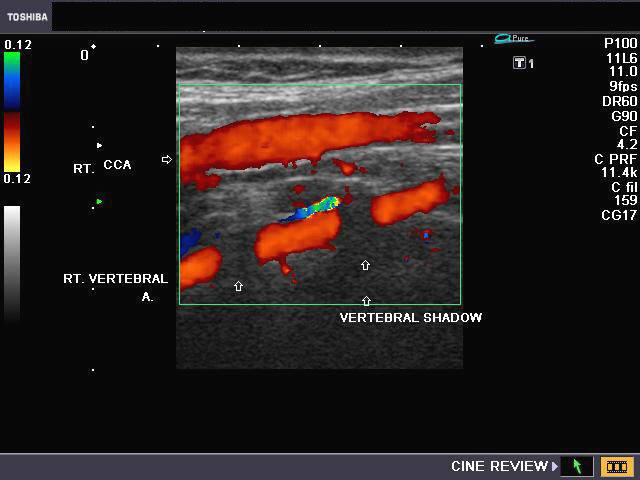
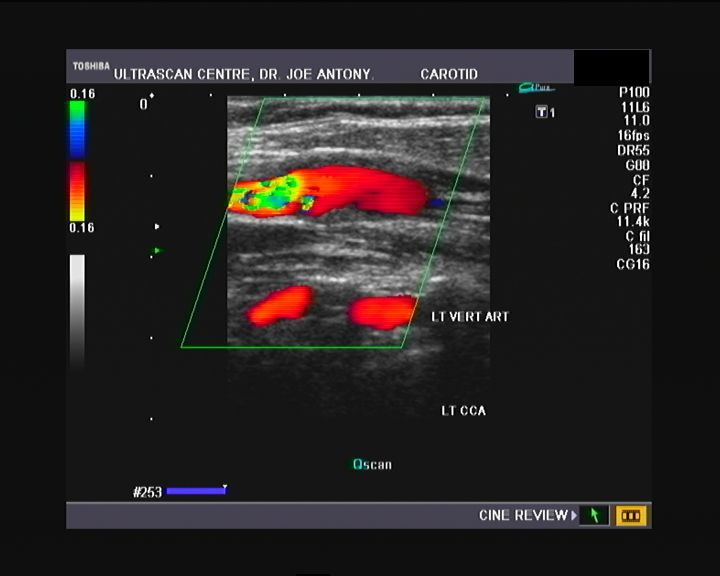
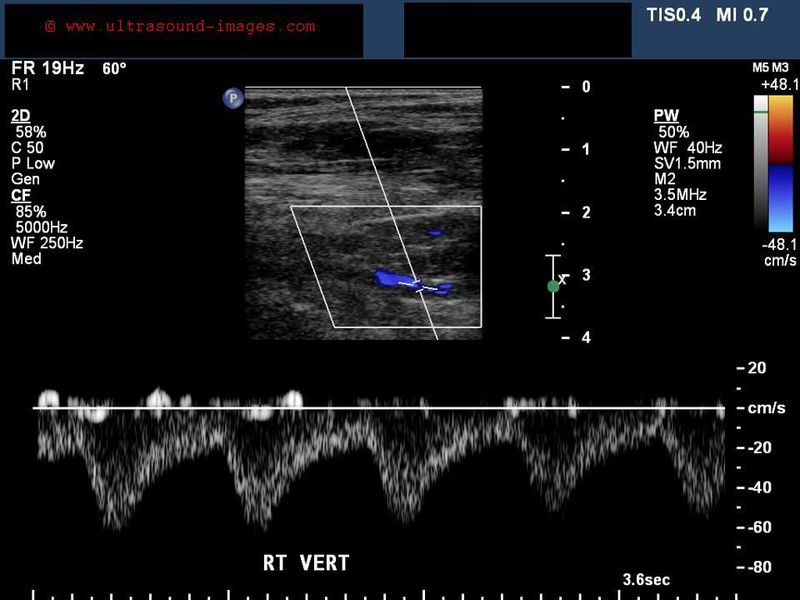
Ultrasound and Color Doppler imaging of vertebral artery
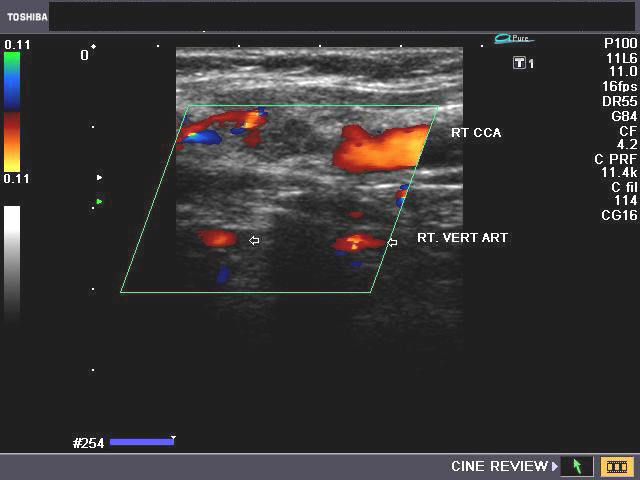
The vertebral arteries course through the foramen of the transverse processes of the cervical vertebrae (from C-6 upwards). The vertebral artery is seen sonographically, between the transverse processes of the cervical vertebrae, as segments. The part within the transverse processes is hidden by the bone. The normal vertebral artery (see color Doppler images above) shows the same direction of flow (and hence the same color as the common carotid artery anterior to it).
Reference: http://emedicine.medscape.com/article/1155193-overview(free article and images).
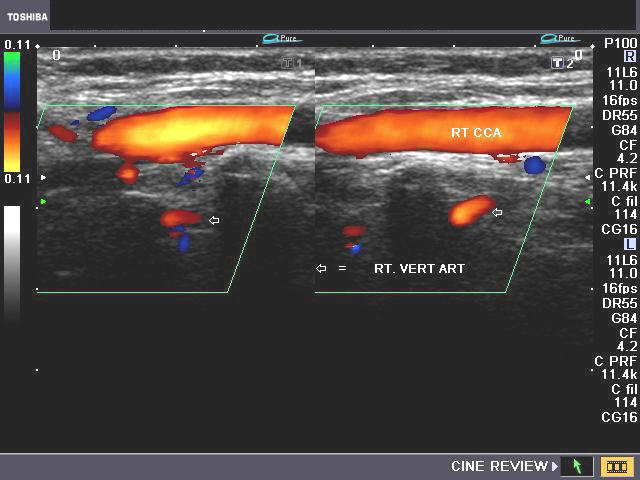
Normal vertebral artery (case-2)
This is one of the best color Doppler images I have saved of the V2 segment of the vertebral artery. Note the same color of the Doppler flow in both Rt. CCA and the ipsilateral vertebral artery. For video clips of color Doppler study of the vertebral arteries
visist: http://cochinblogs.blogspot.com/2010/01/doppler-imaging-of-carotids-is-not-as.html
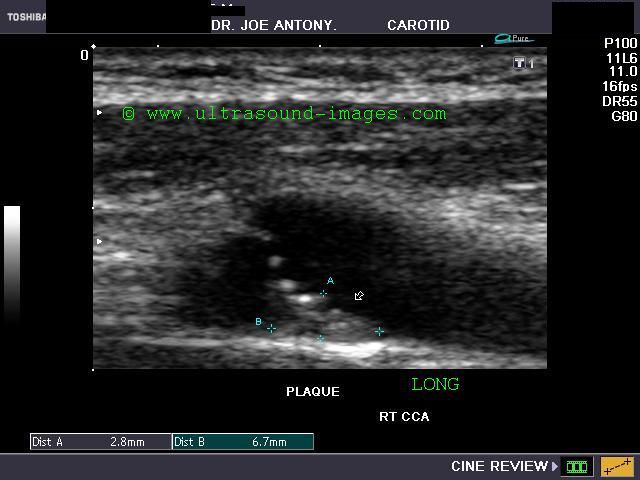
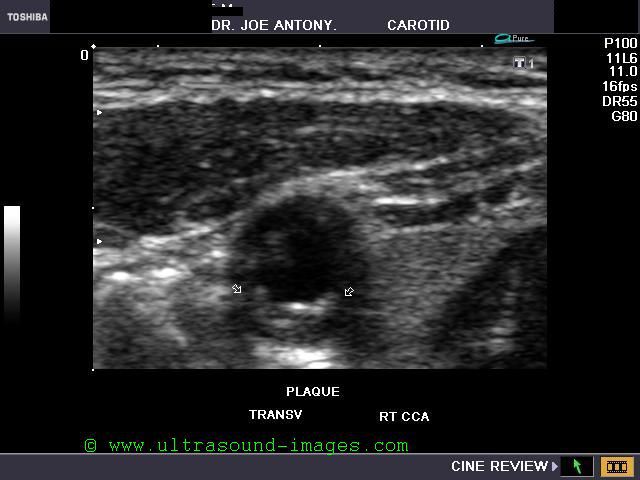
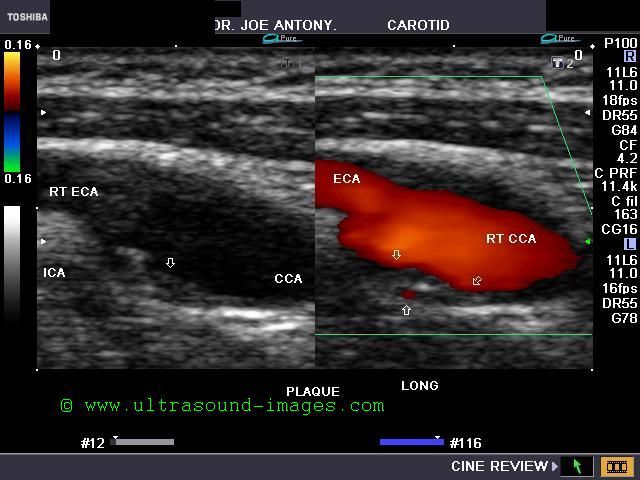
Carotid artery plaque
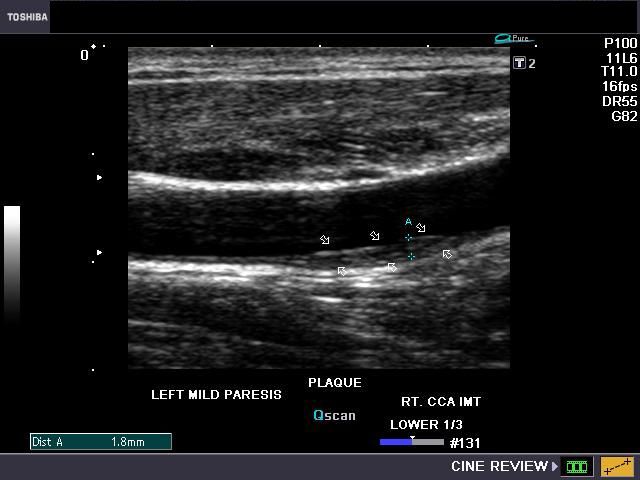
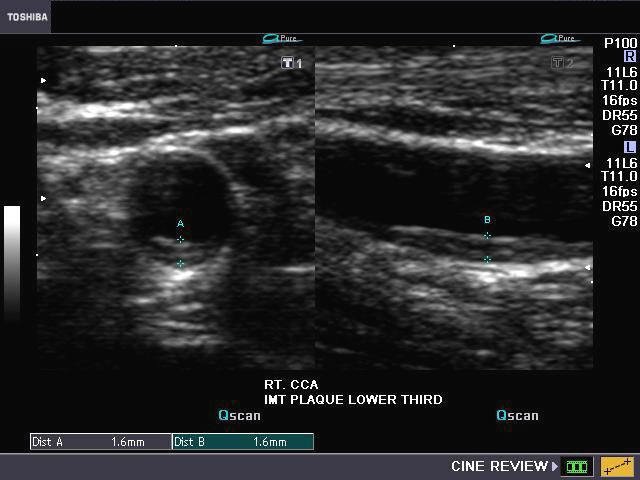
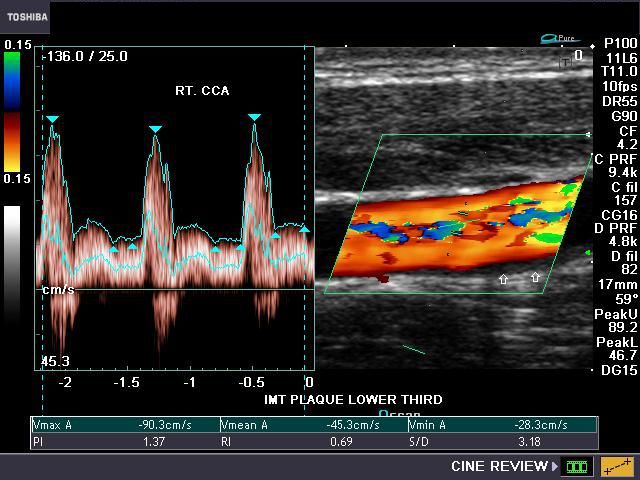
This middle aged male patient had a recent partial stroke affecting the left side of face and left upper limb. The B-mode ultrasound images of the right Common carotid artery show an atheromatous plaque of the lower third of the vessel. This plaque is non calcific and shows no evidence of ulceration. The Color Doppler images of the common carotid artery show no significant obstruction to blood flow in this artery. Possibly, there might have been a small embolic episode some time ago resulting in cerebral ischemia on this side.
Case-2:Carotid artery plaque with calcification and ulceration

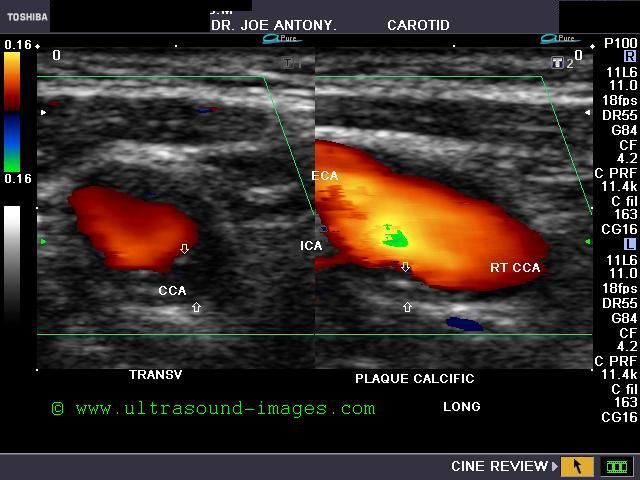
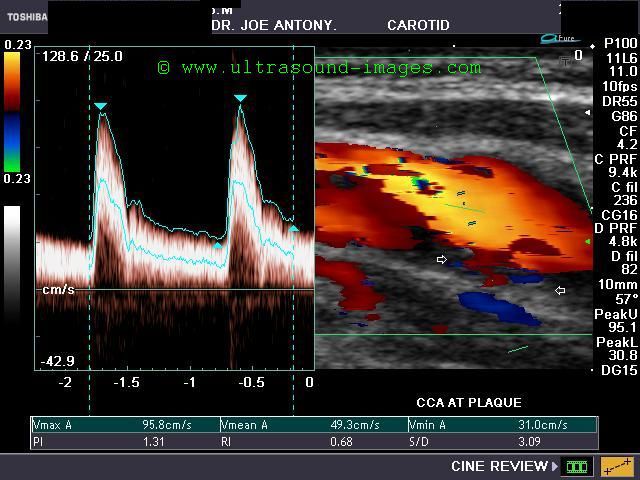
This elderly patient shows a calcific plaque in the right common carotid artery just below the bifurcation. This is a common site for plaque formation. This plaque also shows ulceration of the surface which further complicates the situation increasing the possibility of embolism.The plaque measures about 2.8 mm. in thickness and is 4 x 7 mm in dimension. Color Doppler ultrasound image above shows no significant obstruction (less than 50 % stenosis) to the flow through this area of the carotid artery.The color Doppler and spectral Doppler ultrasound images show and confirm the extent of ulceration of the surface of the carotid plaque. The degree of stenosis of the common carotid artery does not appear to be significant.
Internal Carotid artery occlusion
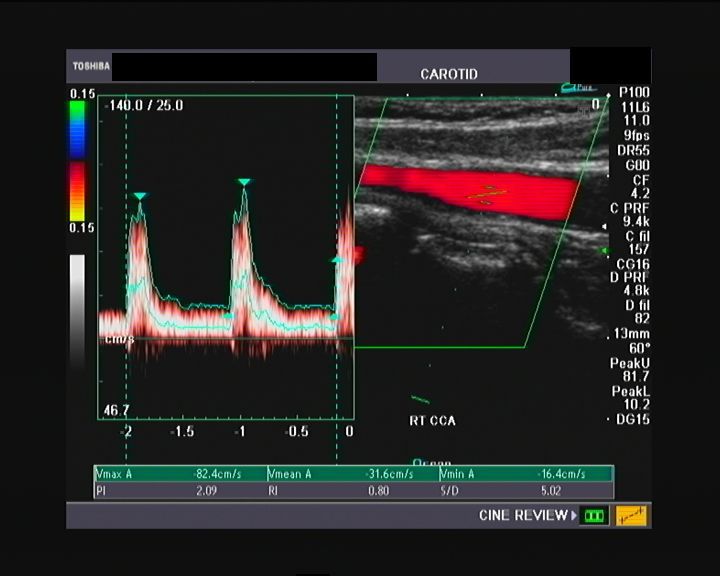

This elderly male patient has a history of right hemiparesis. Ultrasound and color Doppler images of the right Common carotid (CCA) and ICA (internal carotid) arteries show increased peak systolic velocity in both these vessels. However, no major pathology was seen on the right side. The right ECA (external carotid artery) also showed similar changes .The left CCA shows marked high resistance flow with absent diastolic flow and in fact there is flow reversal during diastole. Clearly there is a major pathology on the left side.

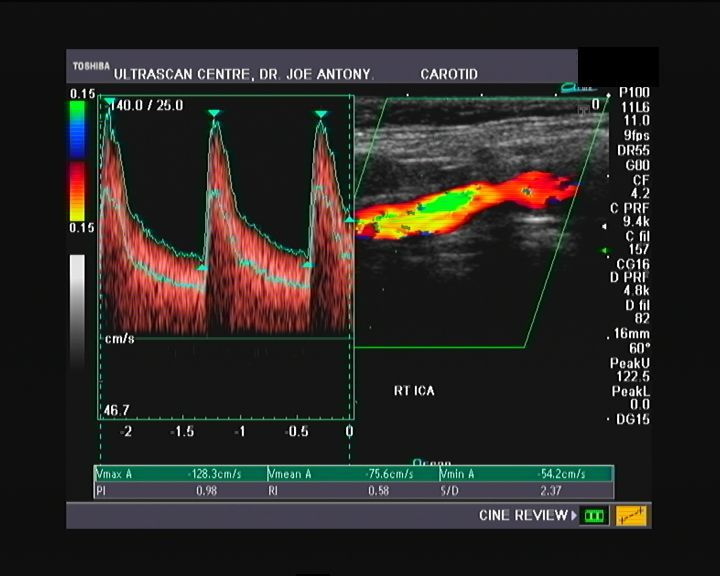
The left side shows an occluded left ICA, with no flow seen in it (see the image in lowest row -left). The left ECA shows very high velocities during systole with moderate diastolic flow. This again is very unusual for the ECA.(We confirmed that the vessel seen above the bifurcation of left CCA was the left ECA by using the temporal tap sign). All these findings suggest a left ICA occlusion with compensatory changes taking place in the contralateral carotid system and ipsilateral CCA and ECA (the left side). These findings/ diagnosis were confirmed by DSA (digital subtraction angiography).
References :
http://radiographics.rsna.org/content/25/6/1561.full (free excellent article)
Ectasia of Internal Jugular vein
(Phlebectasia of Internal jugular vein)
case 1


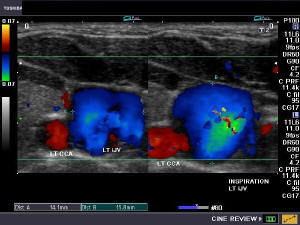
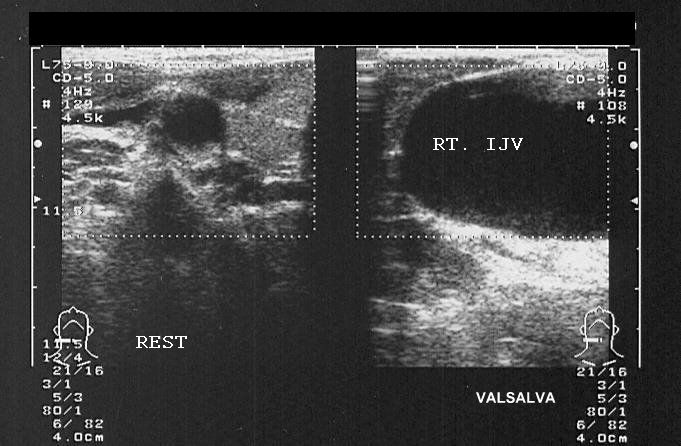
his was a young adult male with complaint of small swelling in the left side of neck and mild dysphagia. On Color Doppler examination of the vessels of the neck, the right side showed normal diameter and flow in the right internal jugular vein and common carotid artery (see image on top left). However the left jugular vein showed a fusiform dilatation of the lower part of the vessel (close to its origin, ie: the proximal portion). Here, the vessel measured almost 12 to 14 mm. in diameter at rest. On deep inspiration and Valsalva maneuver, the rise in intrathoracic pressure resulted in diameter of the Internal jugular vein measuring 15 to 17 mm. (see image at bottom left). Compared to the the IJV on the right side the left IJV (internal jugular vein) also showed marked turbulence of flow both on Color Doppler imaging (see images on bottom left) and spectral Doppler waveform. The ultrasound/ Color Doppler images/ findings suggest Ectasia of the left Internal Jugular vein.
Reference:
http://www.jultrasoundmed.org/cgi/reprint/18/6/411.pdf (free article and images).
Article on Phlebectasia of Internal Jugular vein (free article)
Case-2: Internal Jugular Vein Phlebectasia
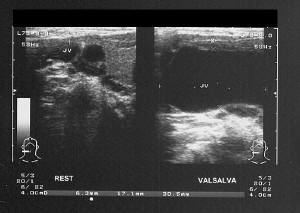
The above ultrasound/ Doppler images show a typical ectasia of the Rt. IJV in a young child. The diameter of the Rt. internal jugular vein is seen to increase from 8mm. (at rest) to almost 23mm. (on Valsalva). Images are courtesy of Ravi Kadasne, MD, UAE.
Color and Spectral Doppler Examination of the veins of the Lower limb
Color Doppler images and imaging of normal deep veins of Lower limb
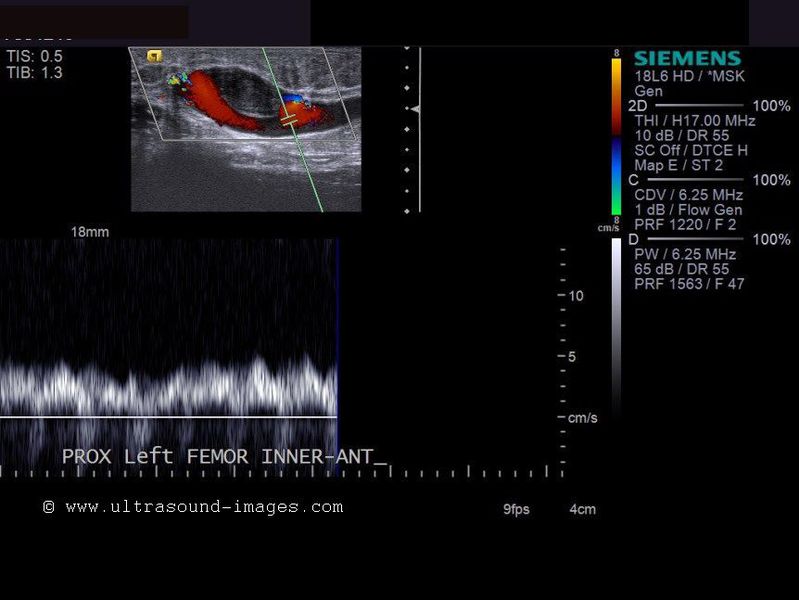
Normal phasic changes in venous flow during respiration
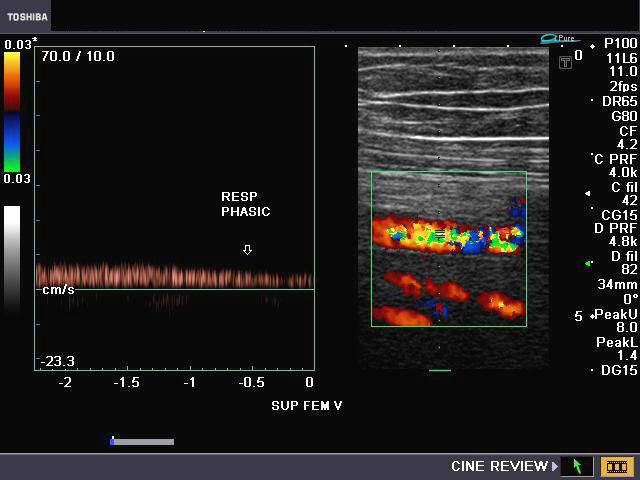
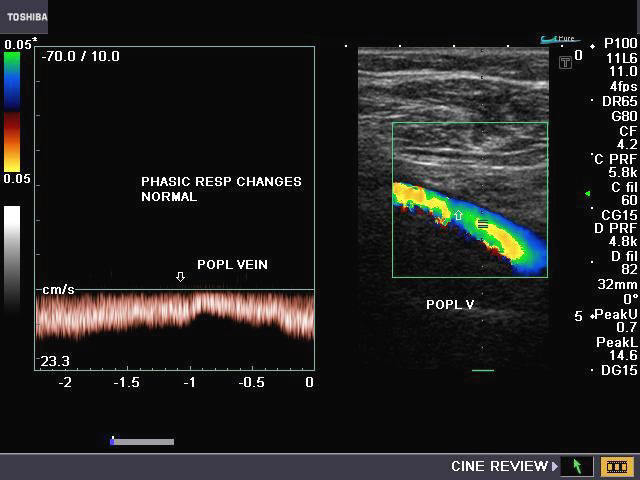
During respiration there are phasic changes seen in the venous flow of the lower limb veins. This is best studied using Triplex imaging, and especially by spectral pattern of venous flow. Upper left image shows changes in flow (in superficial femoral vein), with increase during inspiration, caused by lower intra-thoracic pressure and vise versa during expiration. The Doppler image on right side shows similar changes in the popliteal vein of the same limb. This suggest continuity of flow with transmission of pressure all the way upto the vena cava and the right atrium.
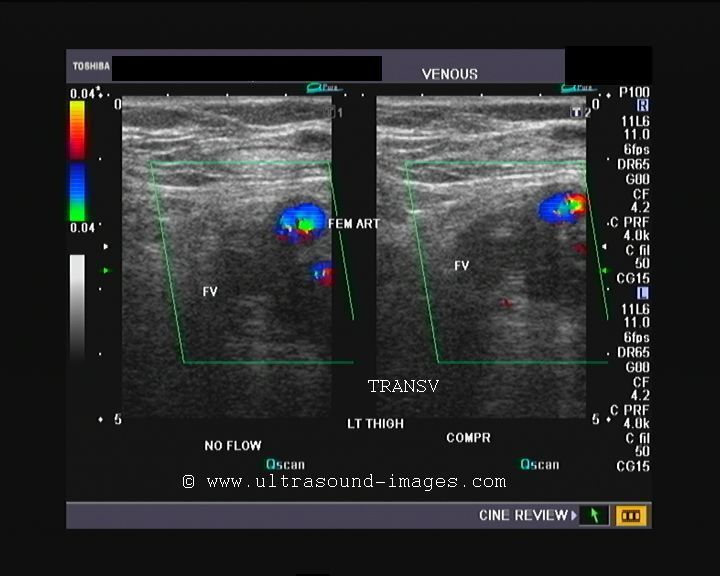
Normal compressibility of the lower limb veins
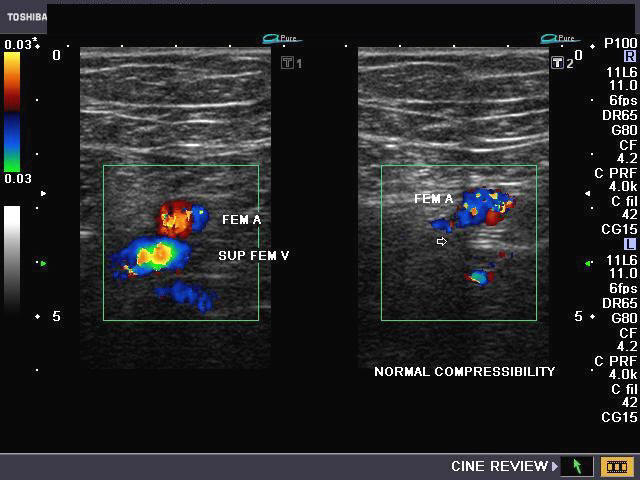
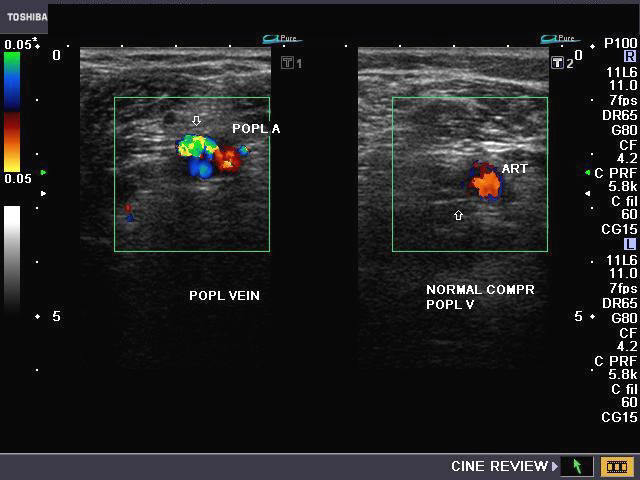
The above 2 Doppler images show the normal superficial femoral vein (Left) and the Normal popliteal vein (Right). Compression of the veins by the Doppler probe causes the normal veins to collapse COMPLETELY (compressibility). Presence of thrombus would cause poor or absent compression of the vessels. Note that the arterial flow is not hampered by the probe pressure. However, the veins disappear in the right half of each image.
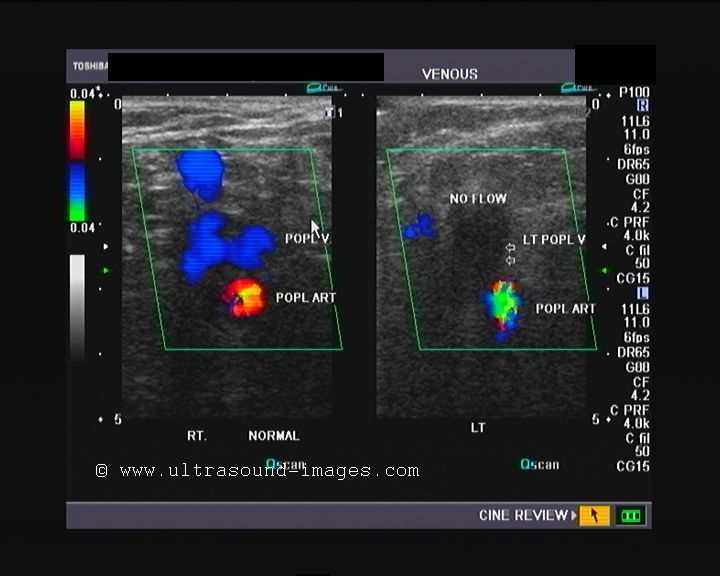
Flow augmentation
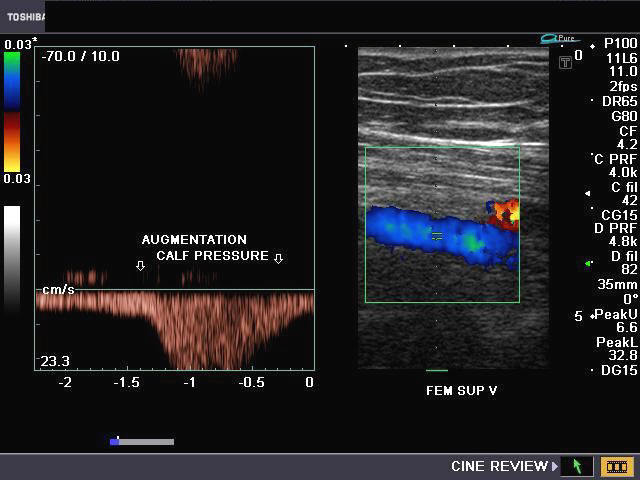

On applying pressure to the lower limb, distal to the veins being assessed, there is increase in flow (spectral Doppler trace). Both the superficial femoral vein (image on Left) and popliteal vein (Right) show marked increase ( flow augmentation) on applying pressure below. This suggests absence of thrombosis in the intervening parts of both veins.
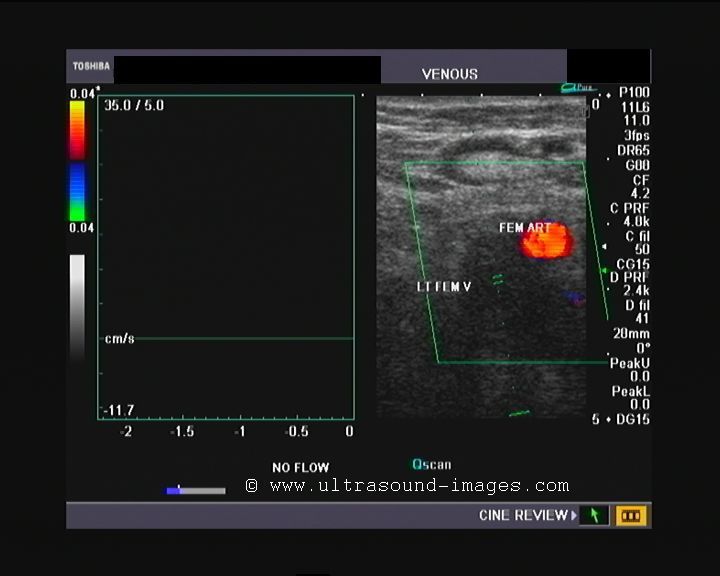
Cessation of flow on Valsalva maneuver

Another technique to assess the patency and absence of thrombus in the part of the venous system above the point of examination is to use the Valsalva maneuver. During deep inspiration and holding of breath, there is normal abrupt cessation of flow in the vein. In image above, the superficial femoral vein shows total cessation of flow. This is therefore, normal.
Chronic venous insufficiency (Incompetence of great saphenous vein)
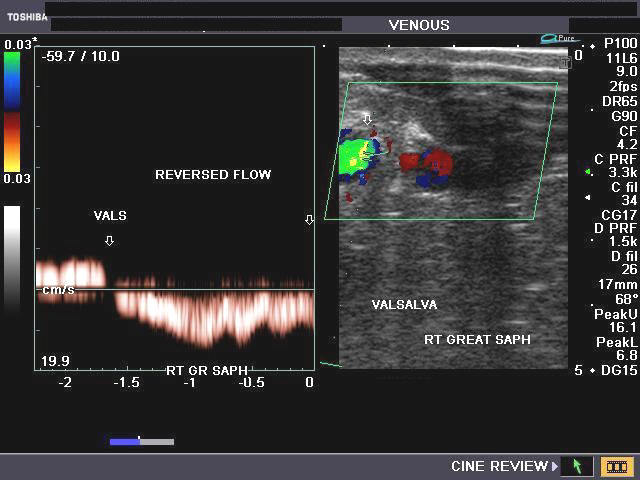
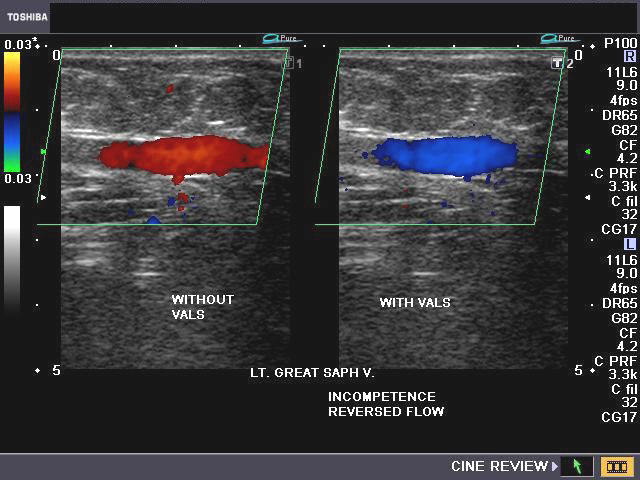
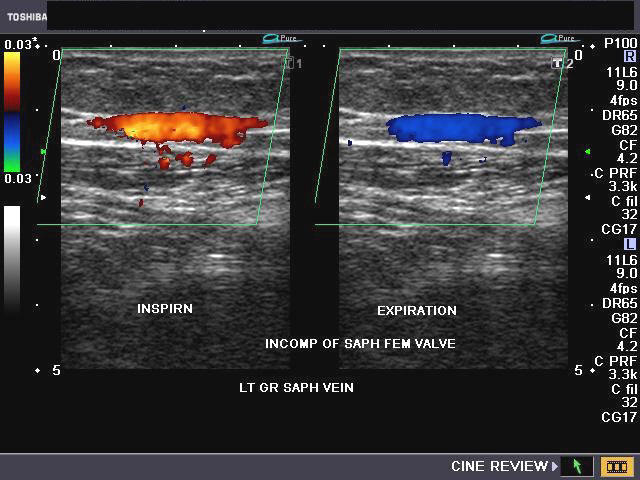
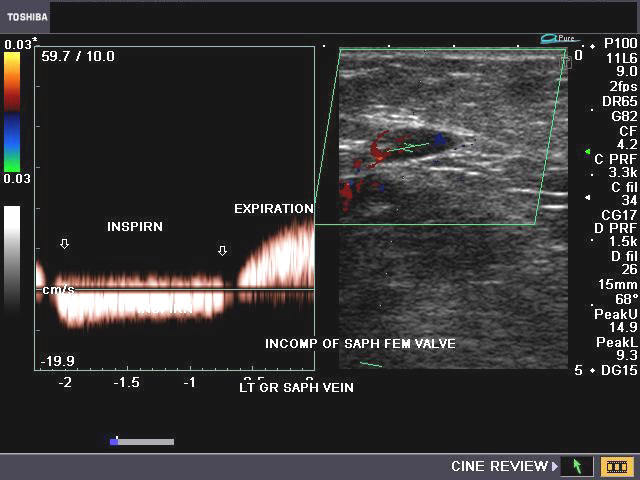
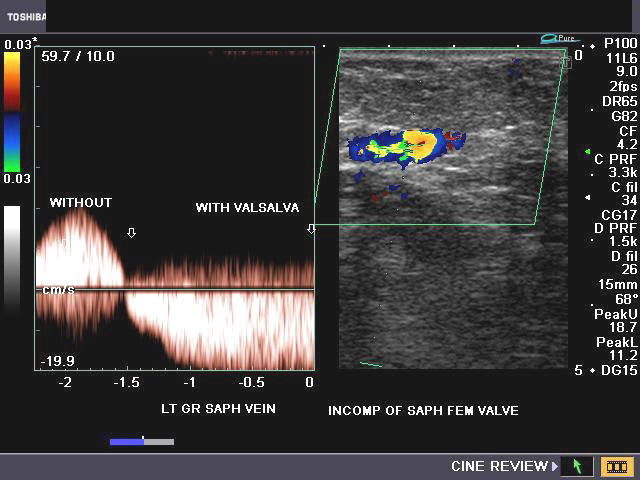
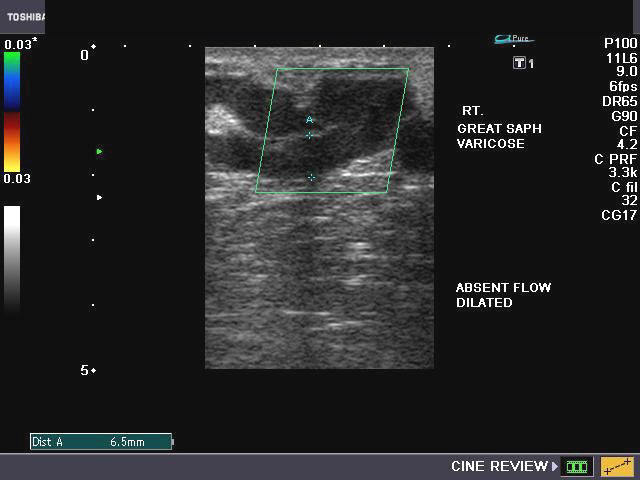
This male patient underwent Color Doppler evaluation of the veins of both lower limbs for chronic venous insufficiency. Color flow imaging and Spectral Doppler images of the great saphenous veins showed-1) reversal of flow in the great saphenous veins of both sides. This is seen as red color (Doppler flow images) on inspiration, and followed by blue colored flow on expiration. Similar changes are seen on Valsalva maneuver. 2) On spectral Doppler trace, the images show typical reversal of flow on inspiration and expiration. This is seen as flow below the baseline, followed by flow above the baseline on expiration or Valsalva maneuver. Both sides thus show incompetence or insufficiency of the sapheno-femoral junction valves. There were also multiple varicose veins seen in the thigh (the topmost row (left) and bottom-most row images shows large veins with poor flow). All ultrasound and Color Doppler images of the Varicose veins and venous insufficiency of great saphenous veins, were taken using a Toshiba Nemio-XG color Doppler machine.
Reference:
http://ves.sagepub.com/cgi/content/abstract/39/4/341 (abstract)
http://www.jultrasoundmed.org/cgi/reprint/26/2/163 (free article)--- excellent
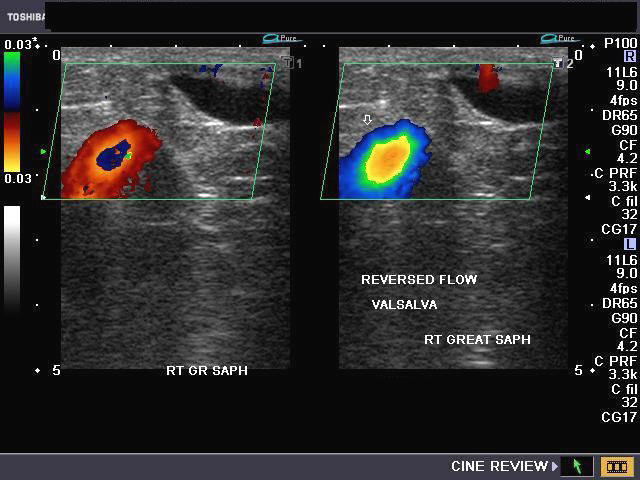
Sapheno-femoral junction and sapheno-femoral incompetence


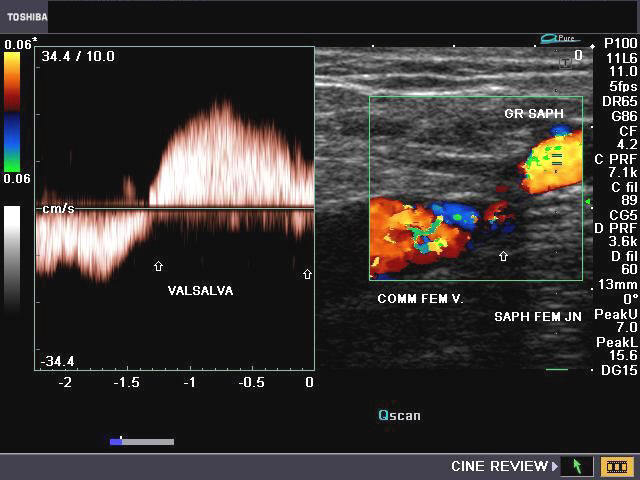

The color Doppler image on top left shows the typical Mickey mouse appearance of the cross section through the Common femoral artery, the Common femoral vein and the Long saphenous vein (great saphenous vein) as it joins the Common femoral vein at the Sapheno-femoral junction. The image (top right) shows typical insufficiency of the sapheno-femoral junction valves, resulting in reversal of flow on Valsalva manoever. (This is seen as blue color on rest and red colored flow on Valsalva). Spectral Doppler trace (images in lower row) show flow reversal on Valsalva. The period of reversal of flow is measured (lower X-axis) and lasts more than 0.5 seconds (here it lasts 1.1 second). This is significant flow reversal s/o insufficiency at this valve.
Incompetent perforators in a case of varicose veins
LEFT: The perforator shows flow to the PTV (posterior tibial vein- BLUE)
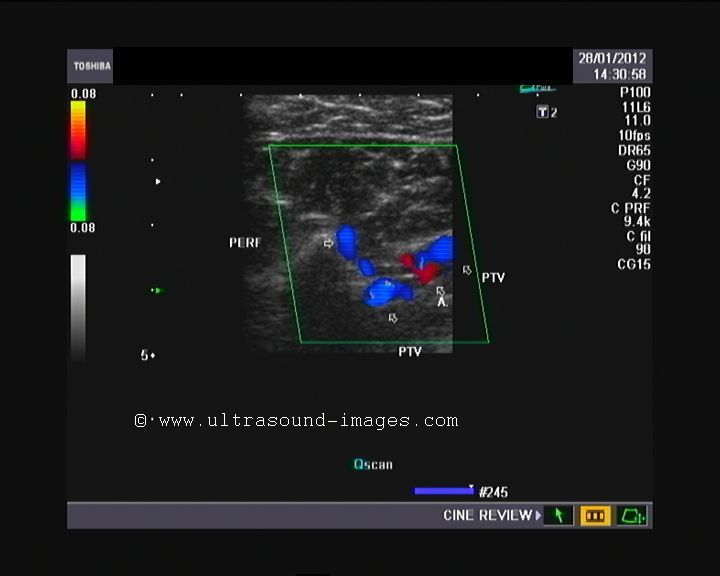
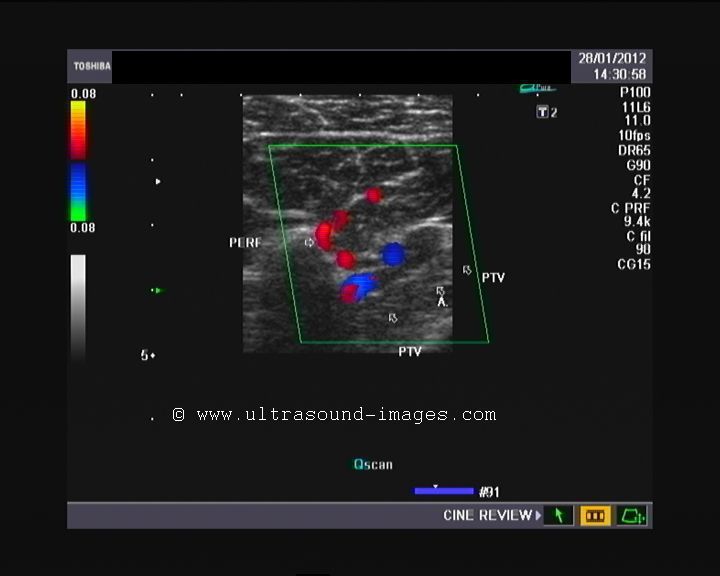
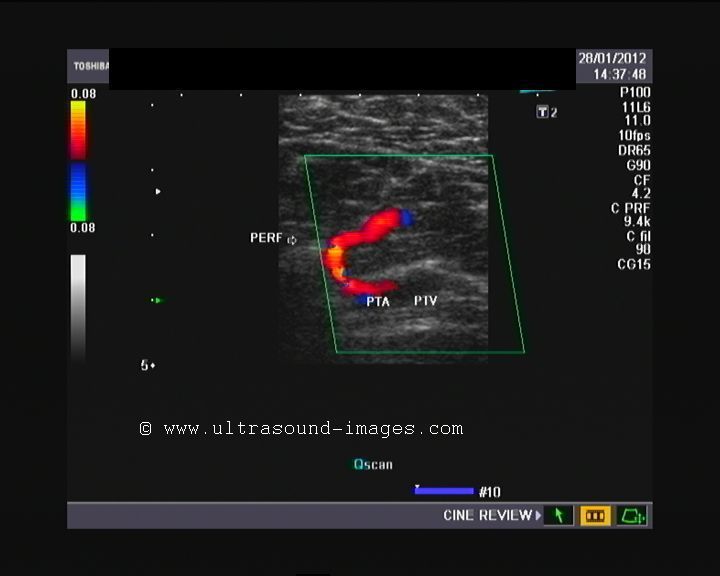
Imaging of perforator veins is simplified by moving / sweeping the ultrasound probe along the transverse axis of the deep veins. The perforator is seen emerging perpendicular to the deep veins (paired Posterior tibial veins here). Perforator veins can be identified as veins that pass from the deep veins to the superficial veins such as the short or long saphenous veins, cutting vertically through the fascial planes. Normal (competent) perforators are seen carrying blood to the deep veins from the superficial veins. Malfunctioning or incompetent valves in the perforators as in the case above result in two way flow in these veins and are seen in varicose vein disease of the lower limbs.
This is a short color Doppler ultrasound video of the incompetent perforator above video).
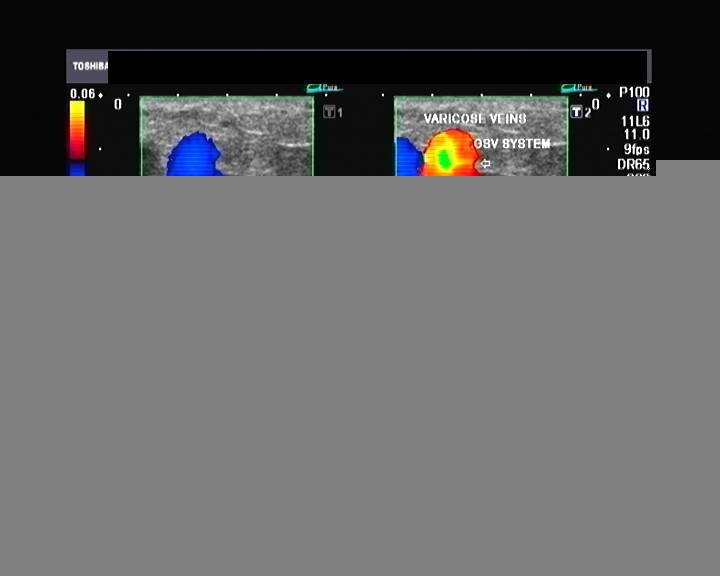
Case-2: severe incompetence of dilated perforator vein
This color Doppler ultrasound scan video of the lower left leg shows a markedly distended perforator vein which shows both blue hue during expiration (flow towards the posterior tibial vein) and red color during inspiration (flow towards the superficial varicose veins of the great saphenous vein system). This alternating blue and red color signals are clearly indicative of severe insufficiency of this perforator vein (see video below).
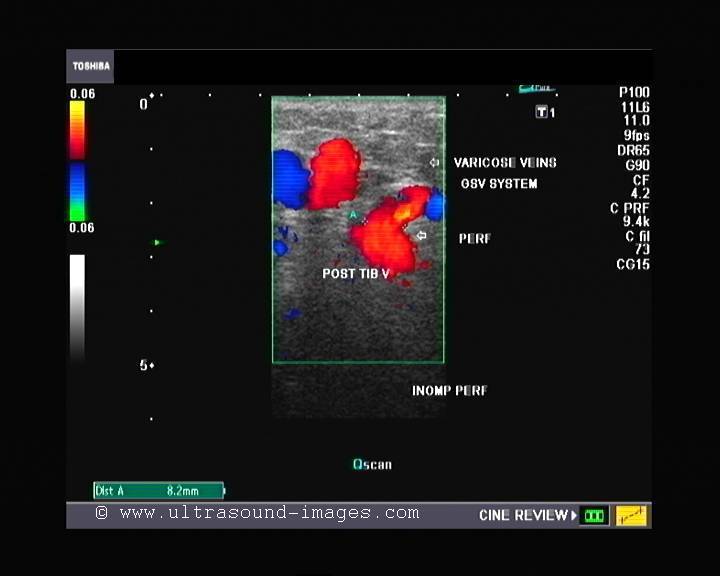
This perforator vein measured more than a massive 8 to 10 mm. in diameter
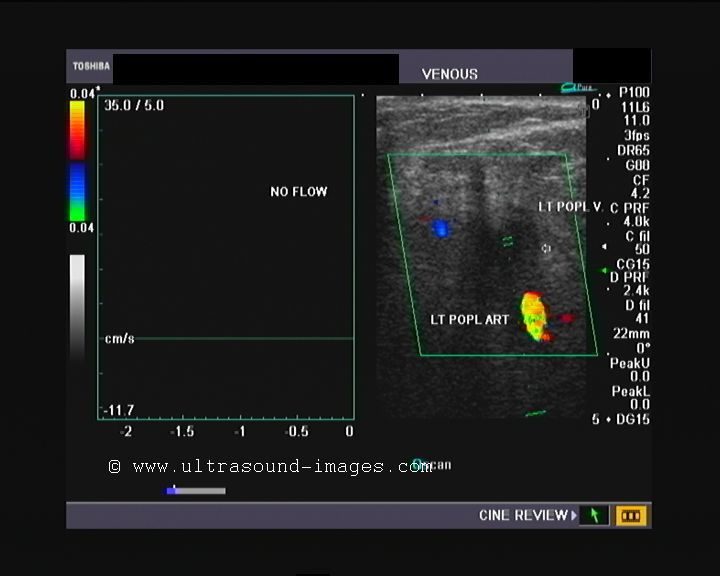
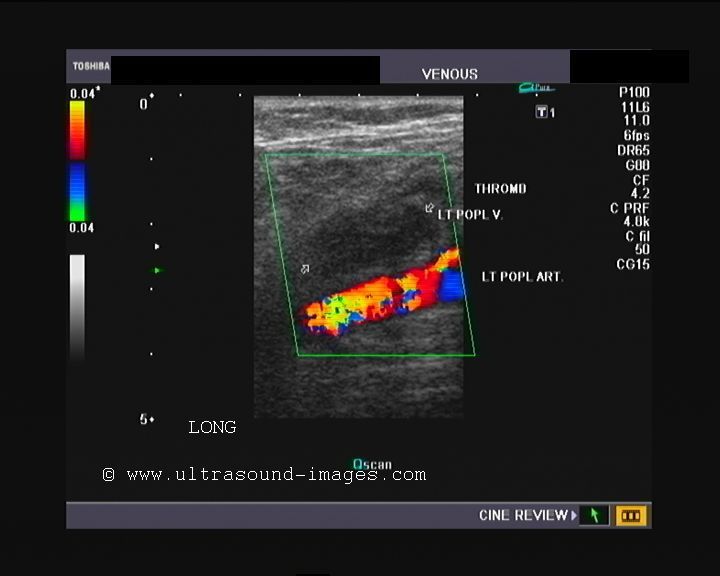
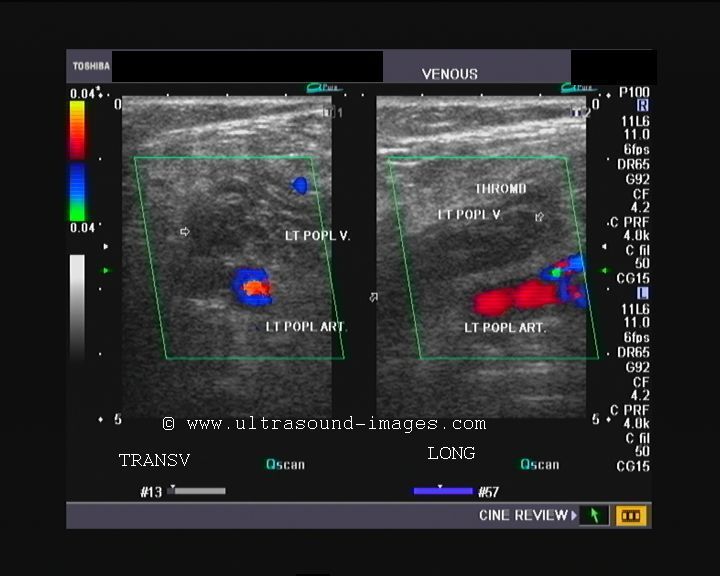
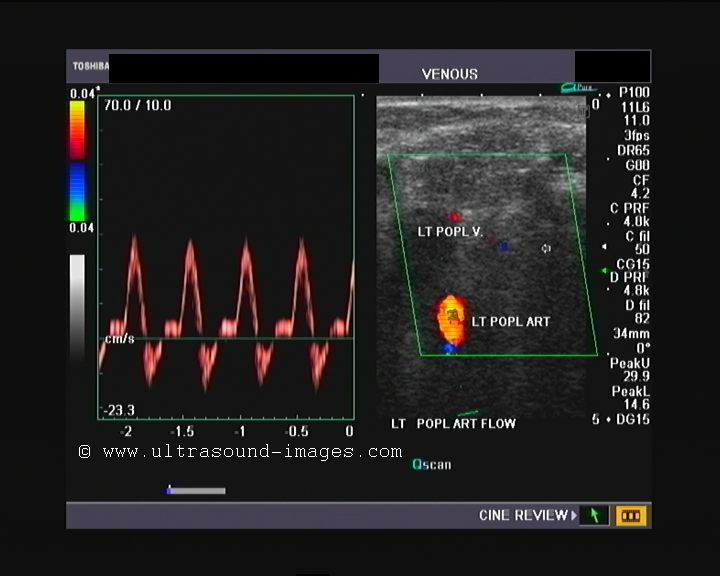
Popliteal vein thrombosis

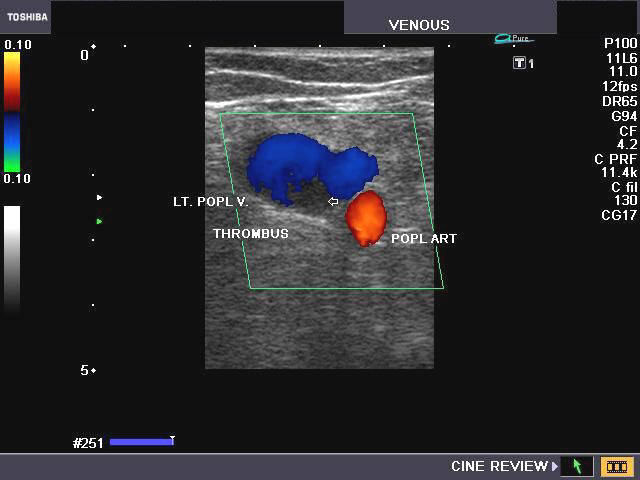
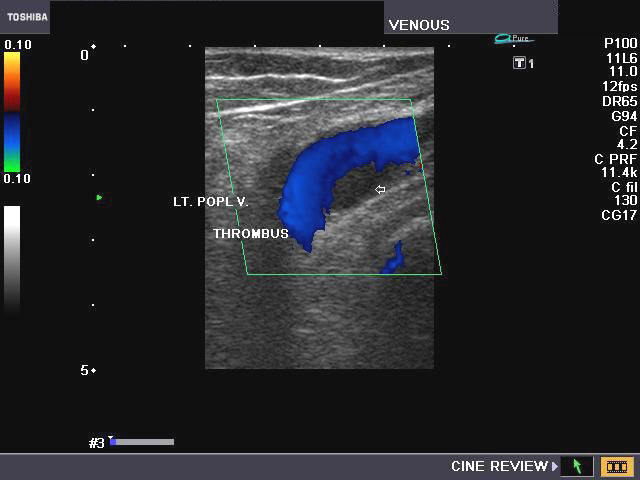

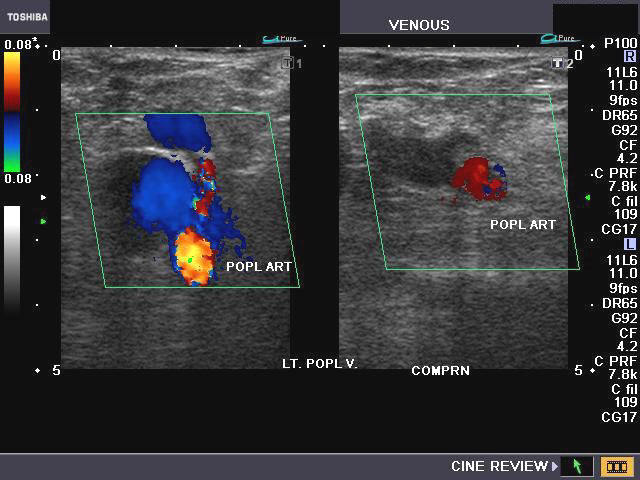
These color Doppler ultrasound images show the left popliteal vein in an elderly female patient with marked varicose veins of both lower limbs. The most striking finding in this case, is the echogenic oval area partially obstructing flow of blood in the left popliteal vein. This color Doppler finding is typical of thrombus in the popliteal vein. Transverse section color Doppler images show failure to fully compress the affected part of the left popliteal vein, which confirms the presence of a thrombus. Note the flow of blood around the popliteal vein. (POPL Art= popliteal artery; Lt. POPL. V.= left popliteal vein).
For Color Doppler videos of this case see:
http://ultrasound-videos.blogspot.com/2010/09/popliteal-vein-thrombus-color-doppler.html
Reference:
http://www.sonoguide.com/dvt.html(free article and videos)
http://smj.sma.org.sg/3601/3601a9.pdf(free article and images)
Femoral vein thrombus
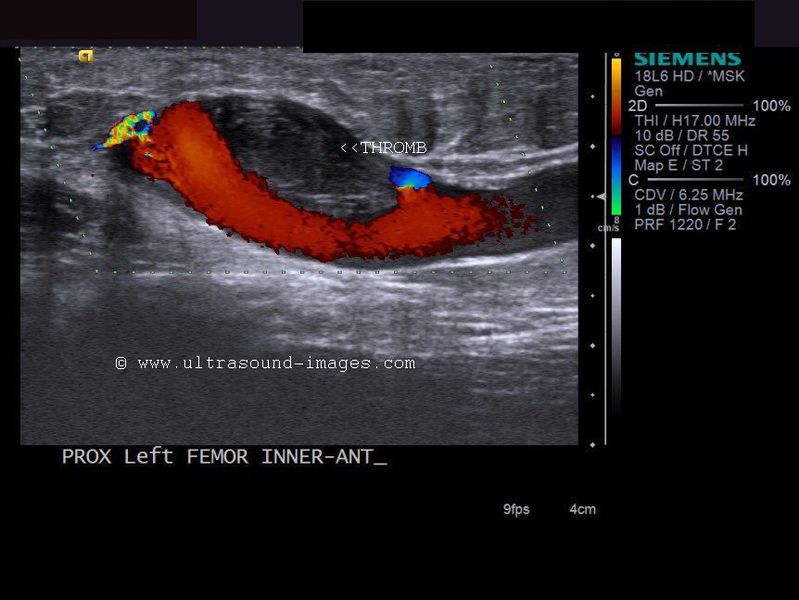

The above color Doppler ultrasound and spectral Doppler imaging of the left femoral vein show a large echogenic lesion in the anterior wall of the vein. There is evidence of partial obstruction of blood flow within the femoral vein, with a thin stream flowing around the obstructive lesion. This appearance is diagnostic of a thrombosis, with partial obstruction of the left femoral vein. Ultrasound and color Doppler images are courtesy of Mr. Shlomo Gobi, Israel.
Reference:http://radiology.rsna.org/content/211/1/9.full.pdf+html(free article and images)
Deep vein thrombosis- thrombus in deep veins of lower limb

This male patient presented with edema and pain of the left lower limb, extending from the thigh to the left ankle. Color Doppler and spectral Doppler ultrasound images show absence of flow within the femoral vein (FV). The image at left shows inability to collapse the femoral vein on compression (COMPR). There was sufficient pressure to mildly flatten the femoral artery, but despite this the femoral vein is not compressible. Spectral Doppler Ultrasound trace shows no flow within the left femoral vein.The femoral veins also shows echogenic material within it suggestive of thrombus.
Color Doppler and spectral Doppler images of the left popliteal vein confirm the presence of thrombus within the left popliteal vein, suggesting a Deep venous thrombosis extending from the left femoral to the popliteal veins. The color Doppler flow image shows normal right popliteal vein, but total absence of flow in the left popliteal vein. Spectral Doppler ultrasound confirms these findings.
The color Doppler ultrasound images of the same case (above) show echogenic thrombus with thickened walls of the popliteal vein. Spectral Doppler ultrasound of the left popliteal artery shown in image above -right, confirms that the vessel occluded is indeed the left popliteal vein. Augmentation of the flow on lower calf pressure, produced a very weak flow in the left popliteal vein (above left), suggestive of some degree of re-canalization of the thrombus. These color Doppler and spectral Doppler ultrasound images confirm the presence of deep venous thrombosis extending from the left femoral to the popliteal vein.
References:
http://radiology.rsna.org/content/211/1/9.full.pdf+html
(free excellent article and images)
http://www.sonoguide.com/dvt.html
http://smj.sma.org.sg/3601/3601a9.pdf
Celiac Artery and its branches
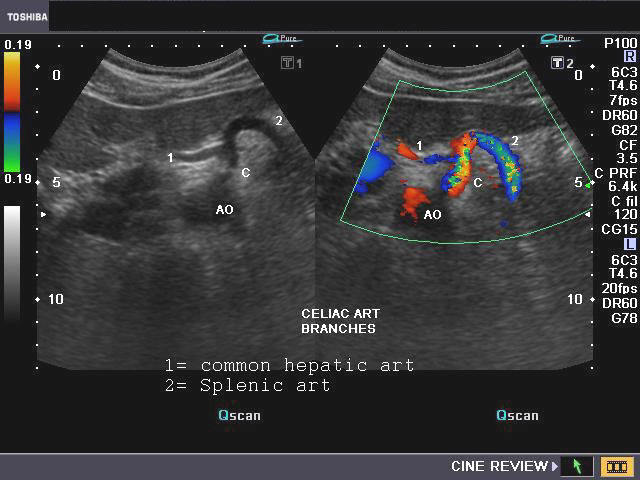
The celiac artery arises from the anterior surface of the abdominal aorta and immediately divides into 3 branches: the common hepatic, the splenic and the left gastric arteries. The above ultrasound and Color Doppler images show the normal celiac artery with the 2 main branches, the splenic and common hepatic arteries. The left gastric is not visualized usually on sonography, being a small branch.
Prosthetic vascular grafts- Color Doppler imaging of axillofemoral graft

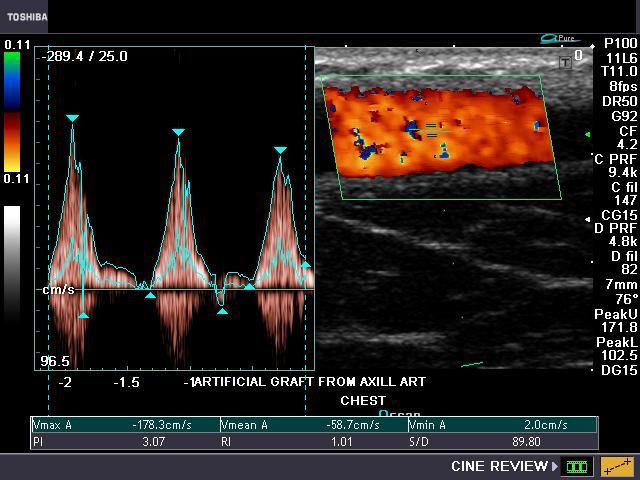
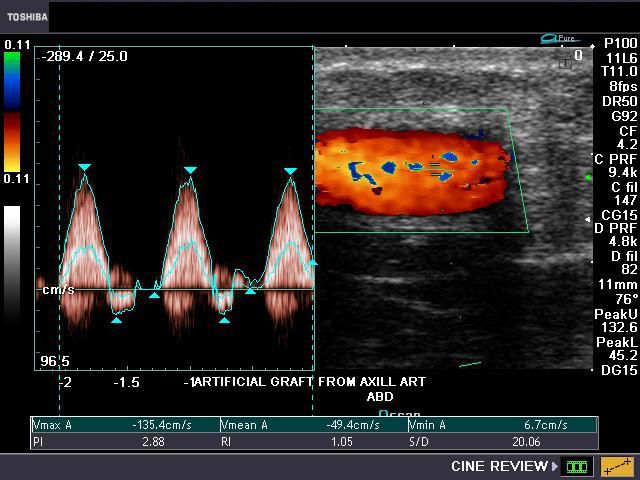

The above color Doppler ultrasound images show a prosthetic axillofemoral graft extending from the right axillary artery to the right common femoral artery in an elderly female patient with occlusion of the right iliac artery. The axillofemoral bypass graft is seen traversing through the subcutaneous tissue of the chest and abdominal walls to the common femoral artery of the same side. This patient was imaged to evaluate the condition of the graft, the presence of any seroma or fluid around the graft, anastomotic aneurysm (at the sites of joining the axillary and femoral arteries). The color Doppler images show normal flow in the graft with no fluid collections or aneurysm.
Reference: http://www.ajronline.org/cgi/reprint/144/5/1005.pdf
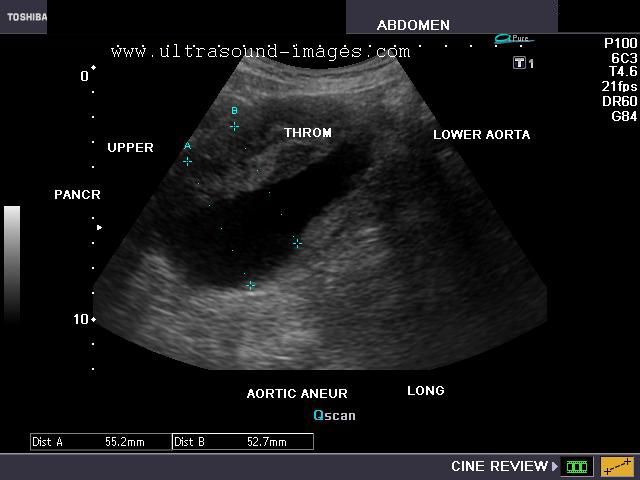
Aneurysm of abdominal aorta
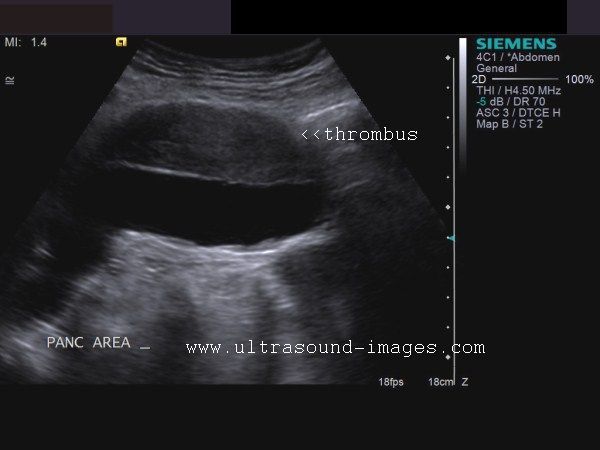
This patient presented with severe abdominal pain and pulsatile swelling of the abdomen. Ultrasound images show a markedly dilated abdominal aorta with a echogenic clot (thrombus) along the antero-lateral aspect of the abdominal aorta. These findings suggest a large aneurysm of the abdominal aorta in its middle third with thrombus. Power Doppler ultrasound image and spectral doppler ultrasound suggest high velocity, and turbulence of the flow within the aneurysmal segment of the abdominal aorta. There is no evidence to suggest rupture of the aorta or leak of blood outside the confines of the aortic walls. The dilatation of the aorta exceeds 3 cms. in the antero-posterior plane. Also this aneurysm is juxta renal and fusiform. The etiology appears to be atherosclerotic. Surgery is urgently required in such cases. Ultrasound images are courtesy of Shlomo Gobi, sonographer, Israel.
References:
http://www.ajronline.org/cgi/reprint/178/3/623.pdf
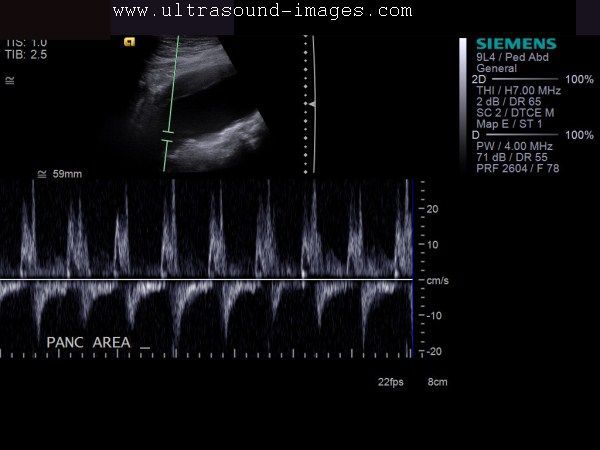
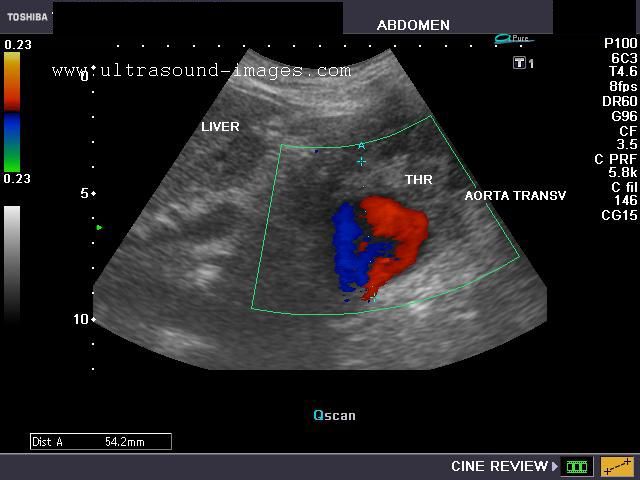
Case-2: Aortic aneurysm

The above ultrasound and color Doppler images of this elderly male patient show a large fusiform aneurysm of the abdominal aorta extending from the level of the left lobe of liver and pylorus (PYL). The wall of the aneurysm also shows a large mural thrombus (THROM). The above ultrasound images are a long section of the aorta.
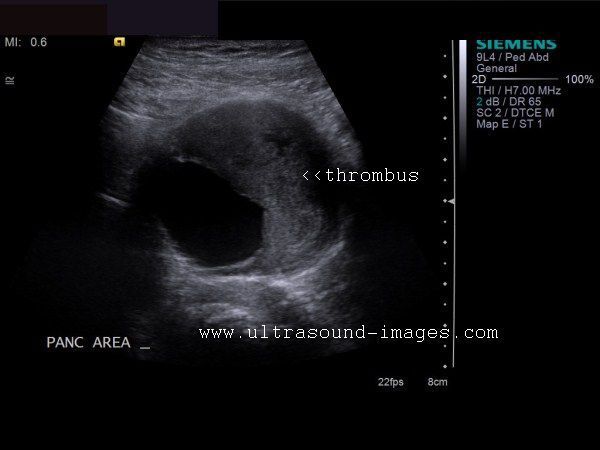
Transverse section of aortic aneurysm
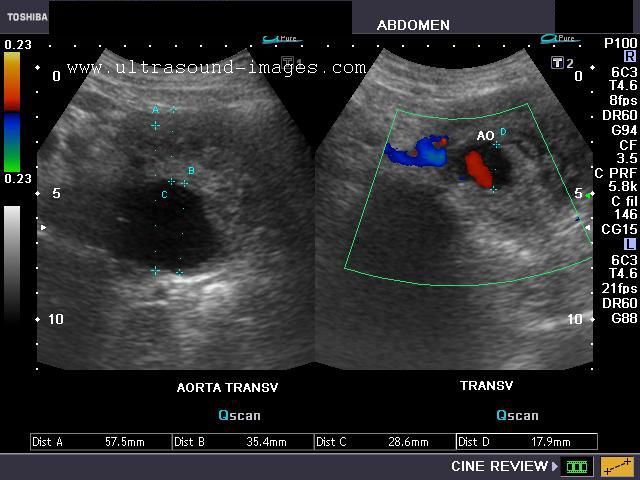
More images of the same case of fusiorm aneurysm of the abdominal aorta: The wall of the aneurysm also shows a large mural thrombus (THROM). The above color Doppler ultrasound images are a transverse section of the aorta.
Aortic aneurysm showing yin yang sign
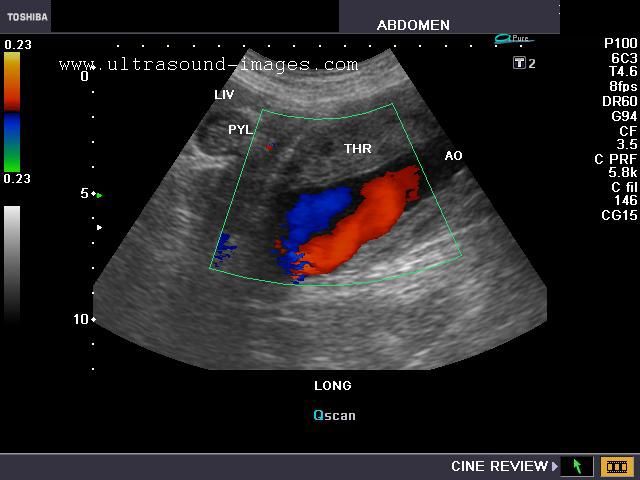
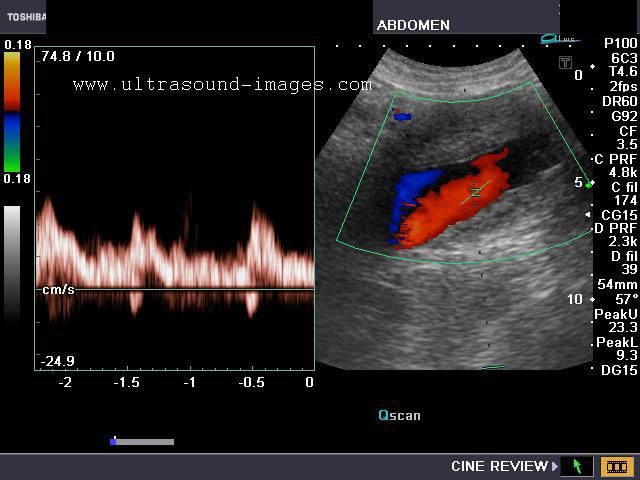
The above long section views of the abdominal aortic aneurysm show the pseudo yin-yang sign of aneurysm (the blue and red colors within the aorta). Turbulent flow is seen in the spectral Doppler tracing of the aneurysm.
Below are the CT scan images of this same case of aortic aneurysm
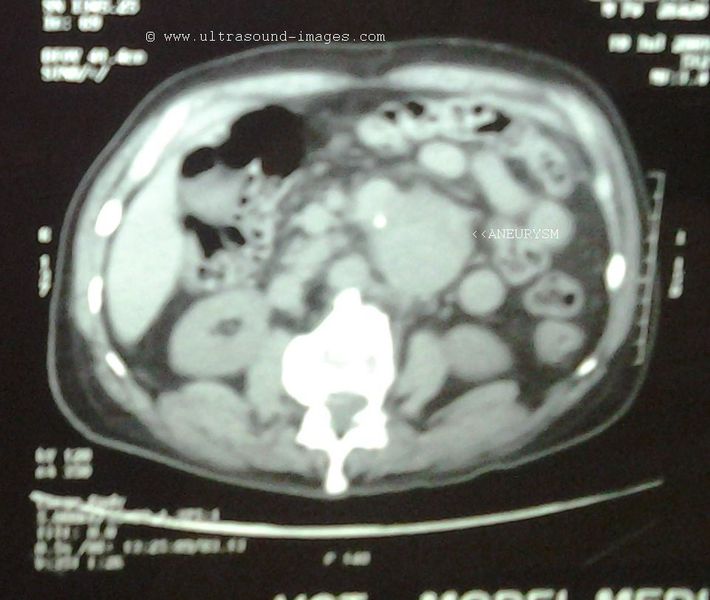
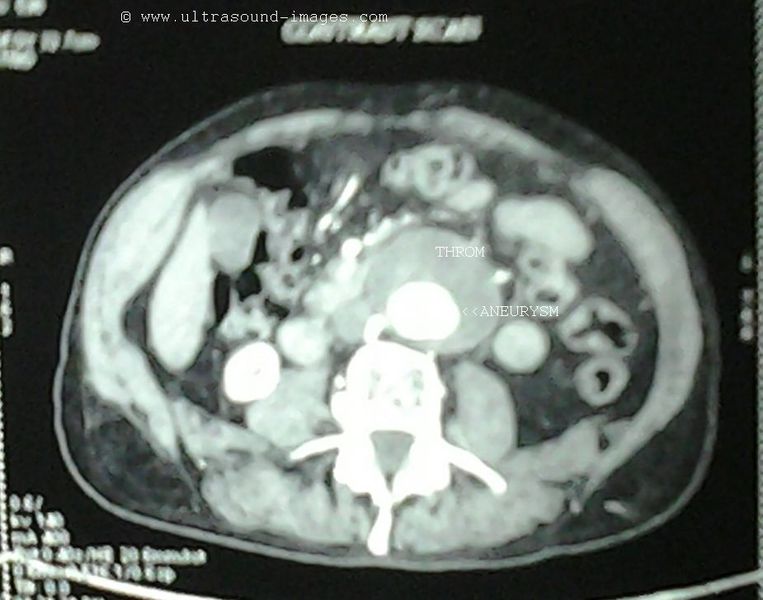
PLAIN CT SCAN IMAGE POST CONTRAST SCT SCAN IMAGE
The above plain CAT scan image shows calcific foci along the walls of the aneurysm diagnostic of atherosclerotic changes in the aorta. The post contrast CAT scan image shows the large thrombus occupying a significant part of the aneurysm of the abdominal aorta. Below are the 3D CT scan images of this same case.
3D CT scan reconstruction of the abdominal aorta
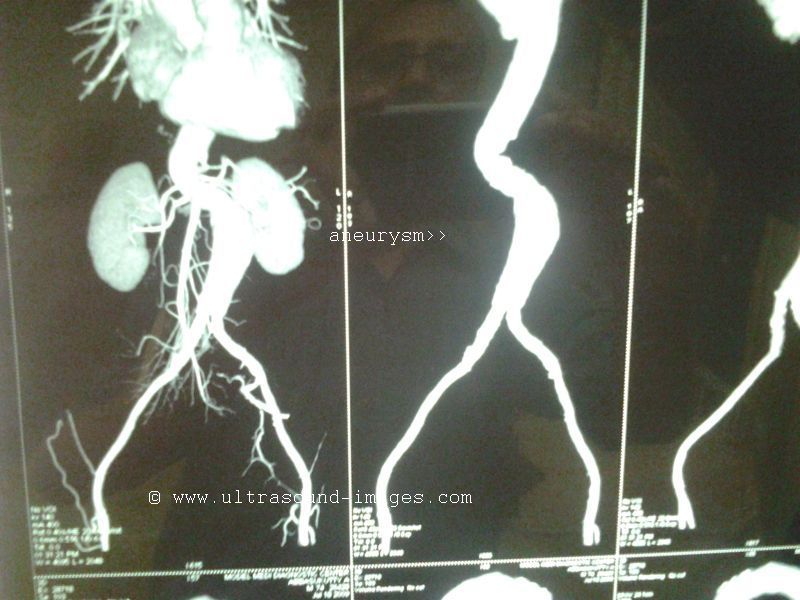
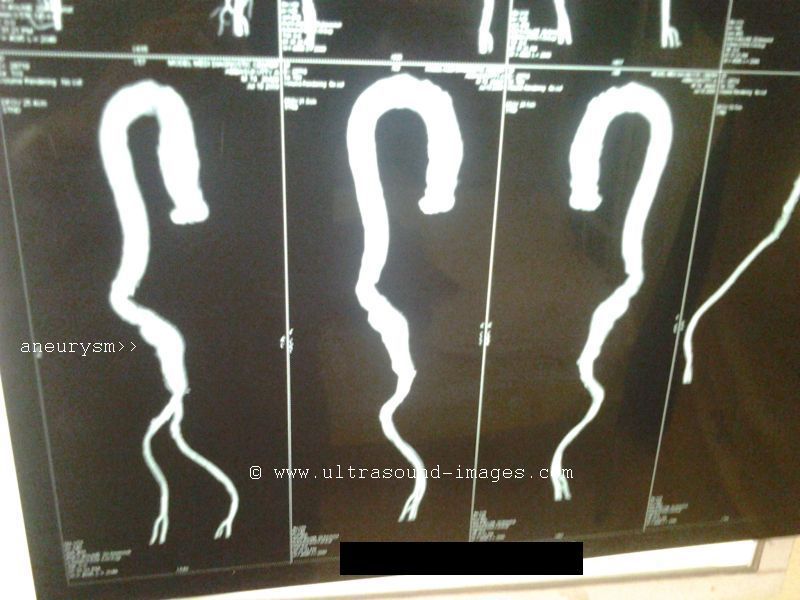
This 3D CT scan reconstruction of the aorta shows the aneurysmal sac of the aorta and its extent from the level of liver to the bifurcation into common iliac arteries. The aorta appears markedly tortuous in its downward course.
For video clips of this case visit: http://youtu.be/4PN0-MNxbC0
and also: http://youtu.be/OErvv9kwmEQ
References: Ultrasound and color Doppler imaging of aneurysm of aorta (superb medscape article)
PICC or Peripherally Inserted Central Catheter (in Inferior Vena Cava)
Transverse section ultrasound image- IVC
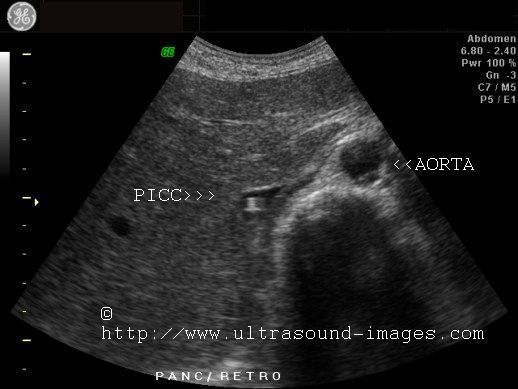
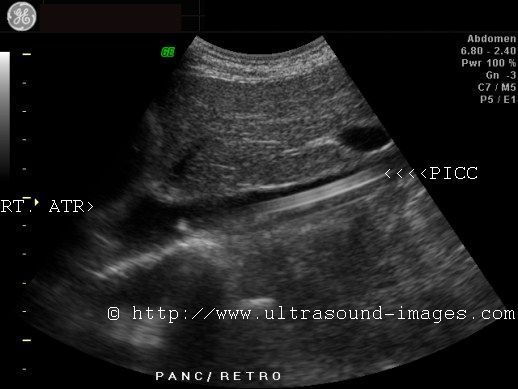

PICC or peripherally inserted central catheters are used in both neonates and adults as a means of nutritional supply via a catheter placed either in the superior or inferior vena cava. The PICC is also a means of providing vascular access for parenteral medication. If placed in the SVC or superior vena cava, the veins of the upper limb are chosen to per cutaneously introduce the PICC catheter; in the ultrasound images above this patient has a PICC line passed via the femoral vein into the inferior vena cava. The tip of the PICC line is usually placed 0.5 to 1 cms. away from the lower margin of the right atrium, as in this case. Ultrasound guidance is used to monitor and guide the passage of the PICC line up the vena cava (in this case- the IVC). The PICC line is seen as parallel echogenic lines within the anechoic IVC lumen. Note the close proximity of the PICC line tip to the lower margin of the right atrium. The PICC line has several advantages over the routine intravenous line used to administer fluids, nutrition and medication. Among these are that the PICC line has lower chances of blockage and infection as well to get misplaced. Above ultrasound images of PICC in inferior vena cava are courtesy of Mr. Shlomo Gobi, sonographer, Israel.
References:
Placement of Peripherally inserted central venous catheters (PICC) (free article on PICC lines)
PICC discussion- ebook on PICC lines
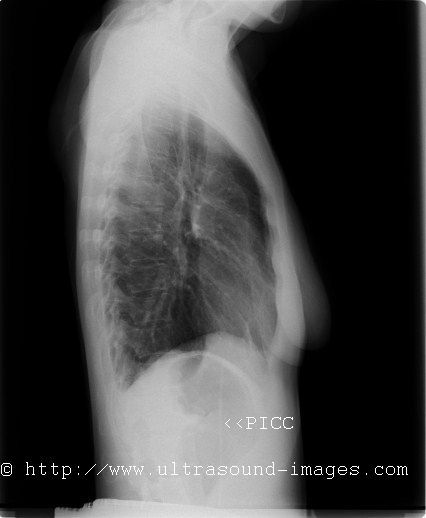
Use of xrays to guide PICC lines(abstract)
Multiple neck artery disease (stenosis and occlusion) with subclavian steal
This is an interesting case with multi-vessel stenosis and occlusion
The left CCA shows absent flow in this image
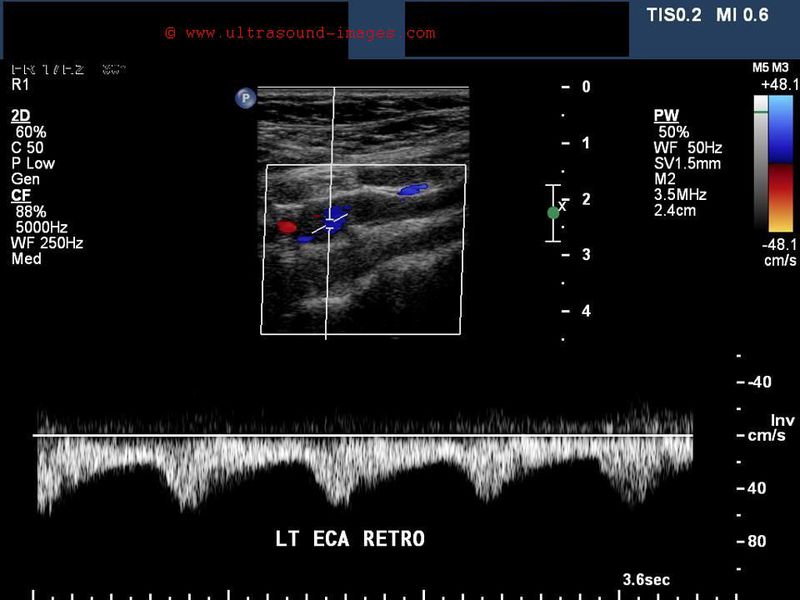
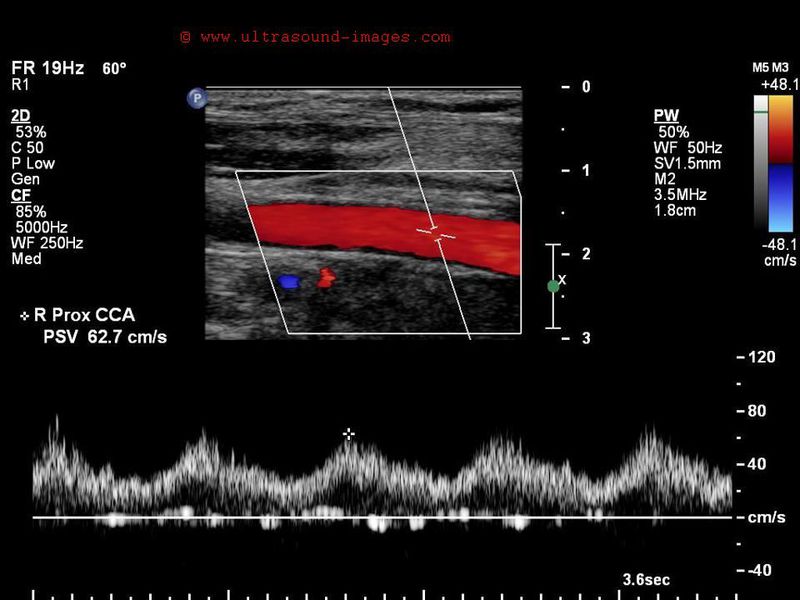
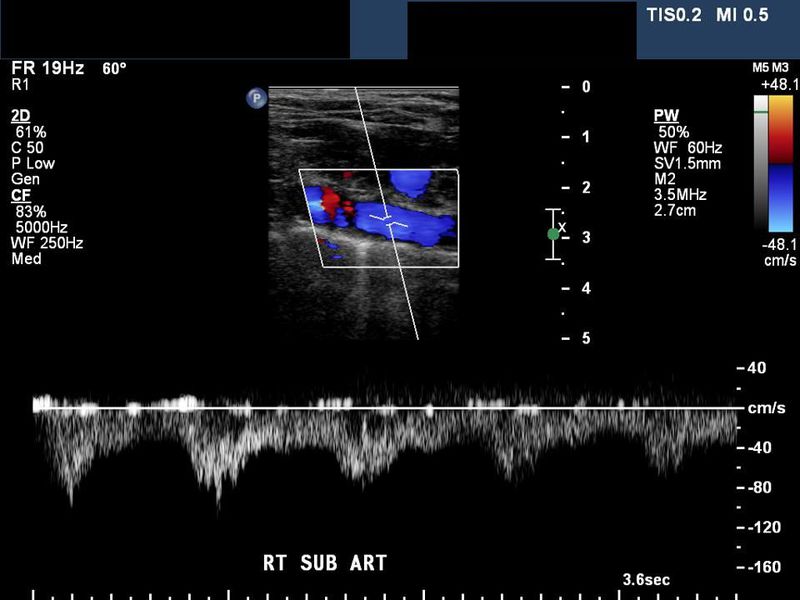
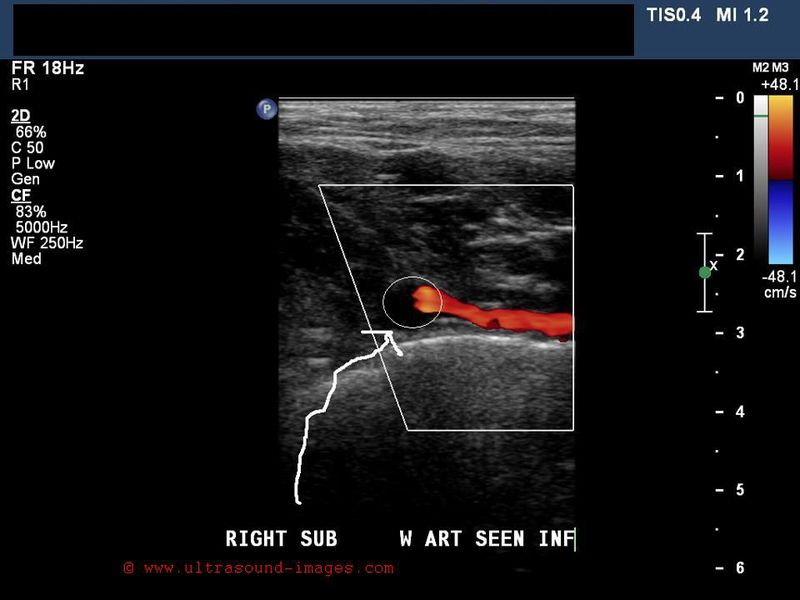
The distal (right side subclavian A.) shows no flow due to the angle: Reversal of flow- right vertebral:
Multiple arterial pathology

This patient has multiple level occlusions- the left CCA is occluded as is the ( on the right) innominate or brachiocephalic artery. There is a left subclavian artery stenosis. The left vertebral artery supplies the left ICA via the left ECA (retrograde flow in left ECA). The right vertebral artery (reversed flow) supplies the right subclavian artery as well as the right CCA. This case and ultrasound/ Color Doppler images are courtesy of Stacey Perrodin, USA.
Internal jugular vein thrombosis
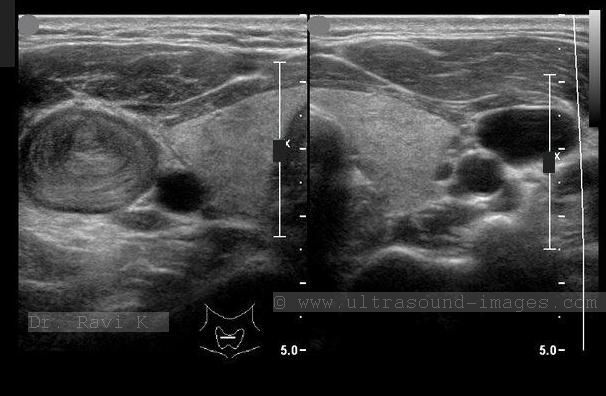
The above B-mode ultrasound image shows a large thrombus occluding the right internal jugular vein (transverse section). The thrombus is seen as echogenic material distending the lumen of the right internal jugular vein (IJV). The normal left internal jugular vein is is shown with anechoic lumen. On color Doppler imaging, (not shown here), there was absent flow in the right IJV. Spectral Doppler showed lack of respiratory phasicity in the distal part of the right internal jugular vein and loss of pulsatility (waveform changes in the IJV due to cardiac pulsations). The etiological factors for such thrombosis of the IJV include head and neck infections, surgery and use of central venous access (cannulation of central veins). Neck massage and intravenous drug use are also known to precipitate an Internal jugular venous thrombosis. This ultrasound image of Internal Jugular vein thrombosis is courtesy of Dr. Ravi Kadasne, MD, UAE.
References:
http://radiology.rsna.org/content/211/2/579.full(free article and images- IJV thrombosis).
http://emedicine.medscape.com/article/461577-overview(e-medicine article - free)
Primary venous tumor of short saphenous vein
Color Doppler image of venous mass
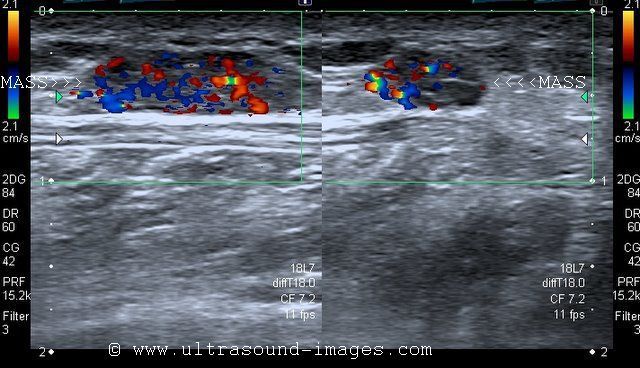
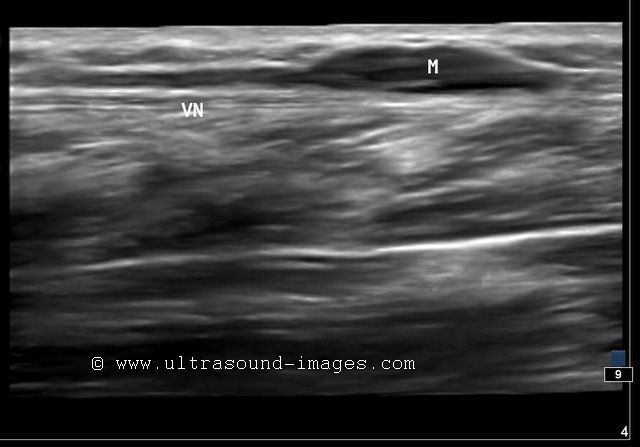
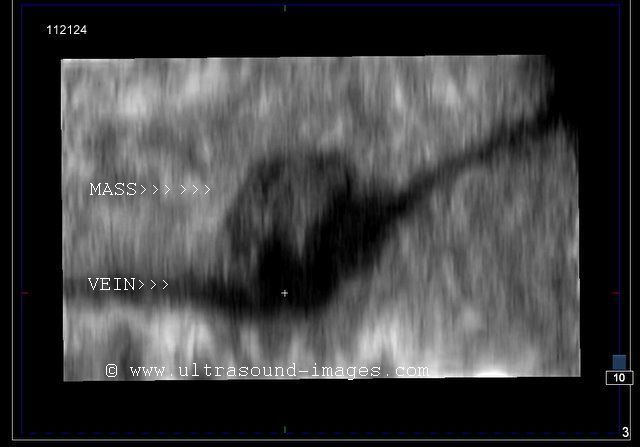
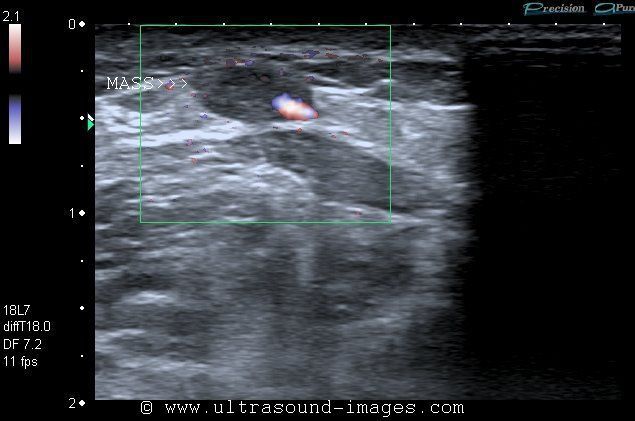
This middle aged male patient presented with a palpable mass of the left lower limb. Ultrasound shows a solid mass along the wall of the left short saphenous vein. Color Doppler and Power Doppler images of the mass show moderate vascularity of the mass within the superficial wall of the short saphenous vein. Primary venous tumors (masses arising from the wall of the vein) are usually malignant and relatively rare. Often they are known to metastatize easily and are often lethal. Among the primary venous malignancies the least common is hemangioendothelioma and more common is the leiomyosarcoma. Ultrasound images of venous tumor of the short saphenous vein are courtesy of Dr. Ravi Kadasne, MD, UAE.
References:
1)Primary venous malignant tumors of the lower limb- Pubmed article
2)http://www.casesjournal.com/content/3/1/71 (leiomyosarcoma of IVC)
3)http://www.hindawi.com/journals/crim/2011/123041/ (primary iliac vein leiomyosarcoma)
© 2026, Joe Antony, MD All images and content in this site are copyrighted. www.ultrasound-images.com When visiting this site, we may use cookies to improve the performance of this site. Use of this site means you accept the use of cookies. Read our privacy policy at this page: https://www.ultrasound-images.com/privacy-policy/